Main menu
You are here
Synoptic Images of the Sun
 A synoptic map (or a latitude-time map) of the Sun shows the evolution of the Sun over a given period of time in a single image. The PROBA2 team have created a synoptic map of the Sun for whole Carrington Rotations. A Carrington Rotation is a period of time chosen to represent one rotation of the Sun, allowing the comparison of features such as sunspot groups or active regions. A period of 27.28 days was chosen to represent a single rotation that largely resembles the recurrence time of features near the equator (more information can be found here). An example image can be seen in Figure 1 below.
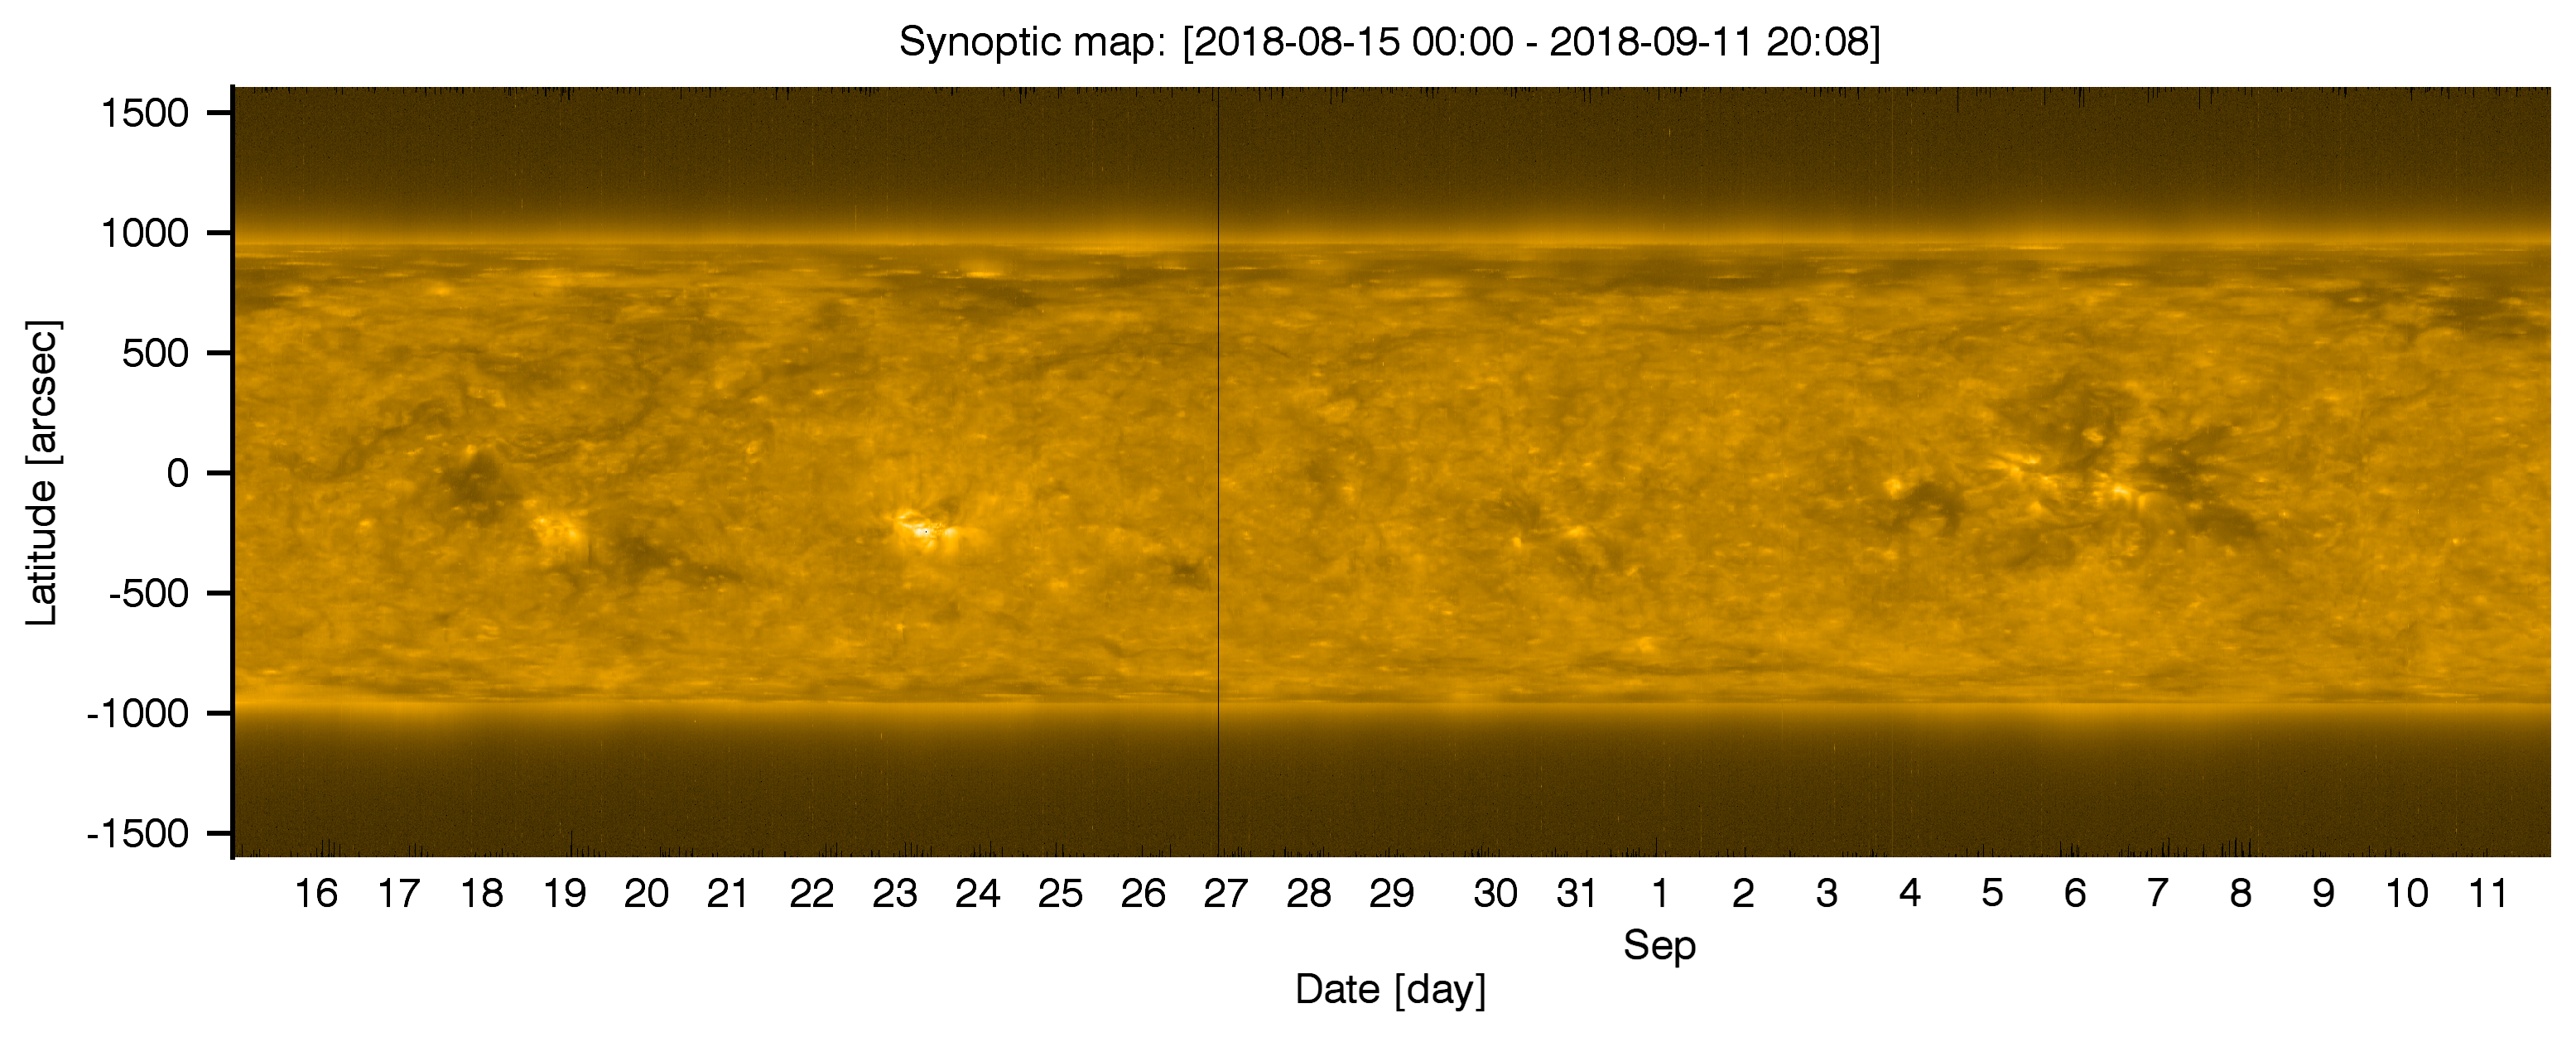
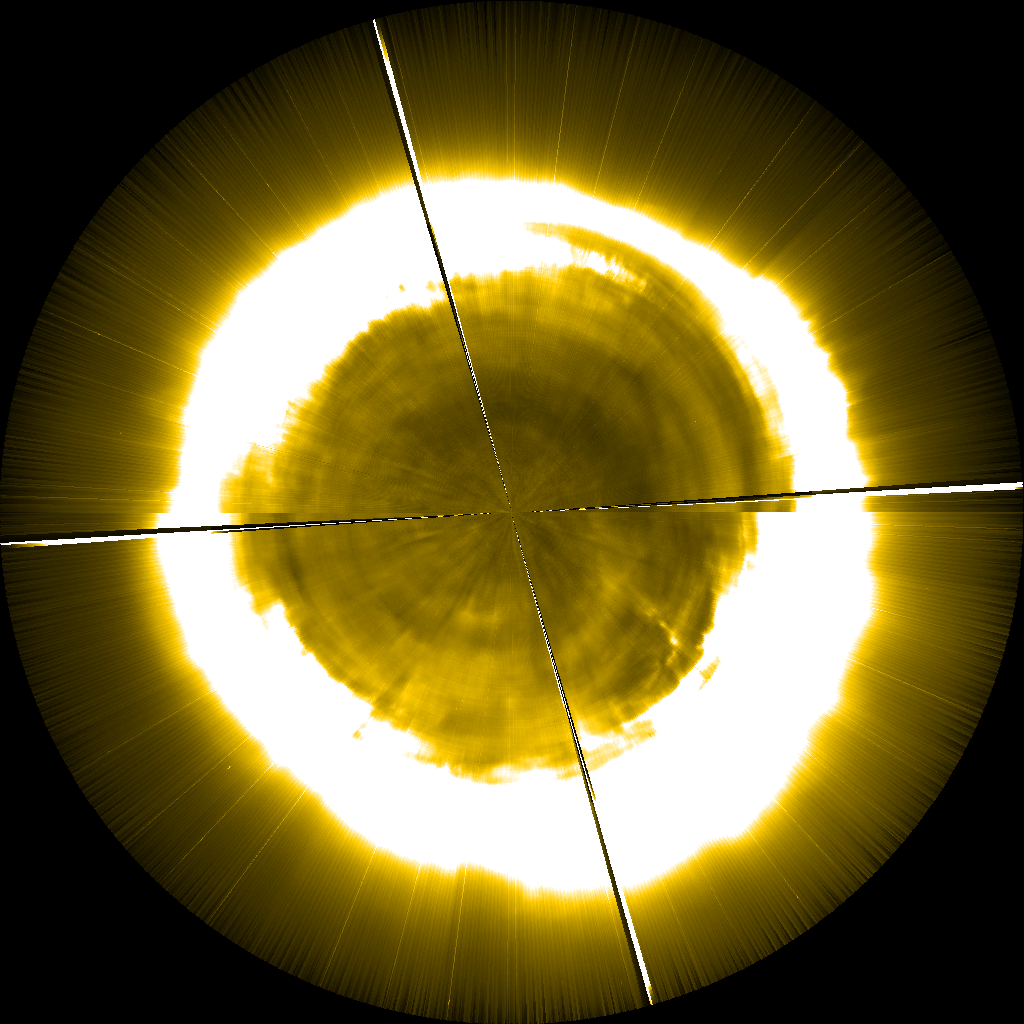
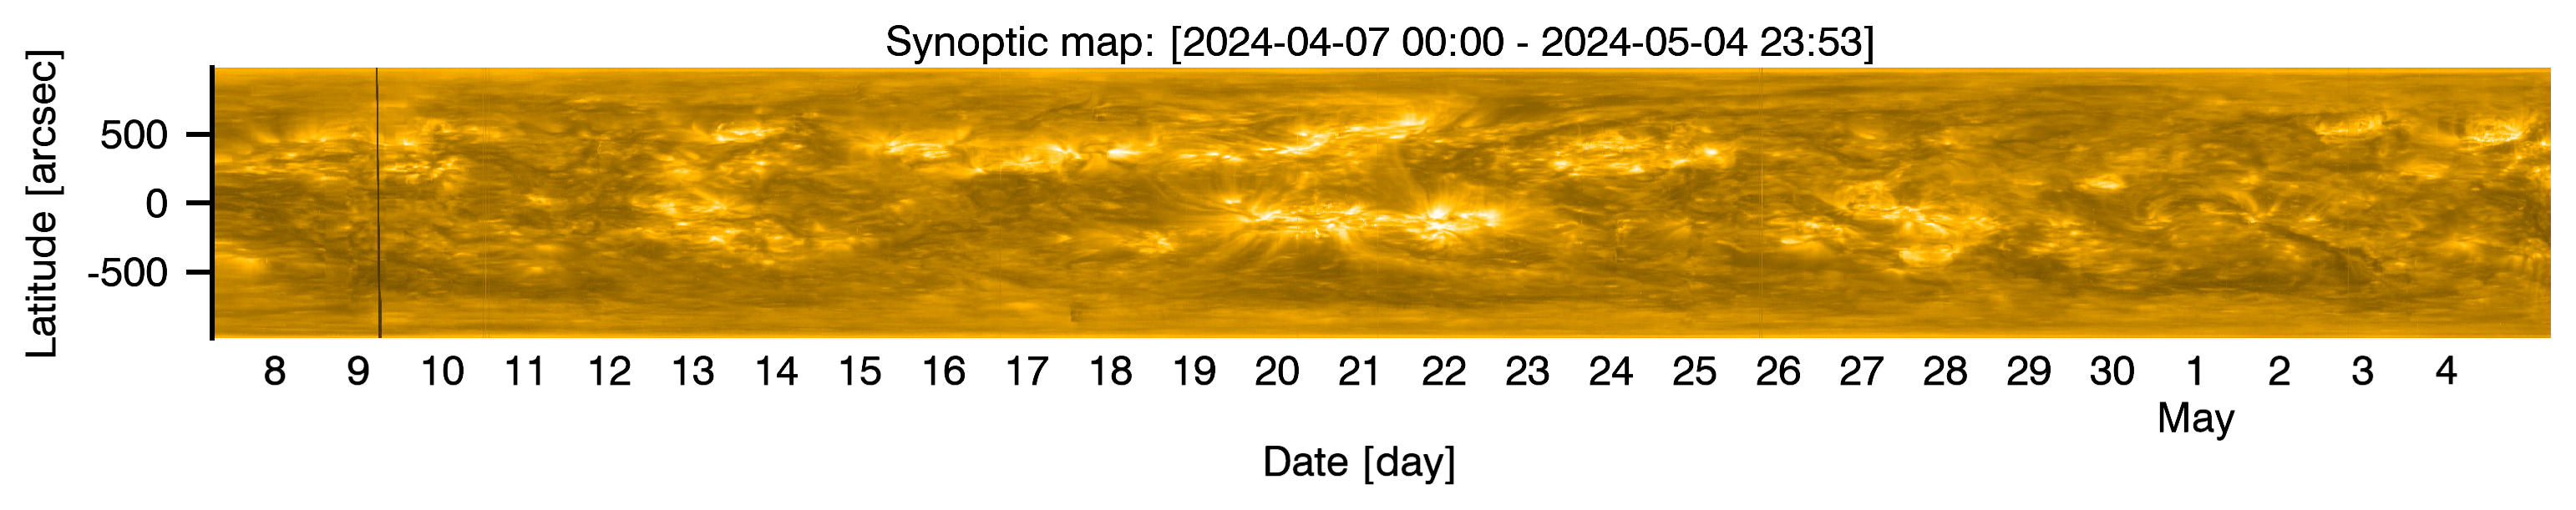
Each SWAP synoptic map is constructed by extracting 3 pixel wide strips from individual images, taken at random intervals throughout a Carrington Rotation. Each 3 pixel wide strip is averaged into a single strip to remove artefacts in an image that might be created by events such as cosmic rays and Solar Energtic Particles striking the detector, or from radiation from the Earth's radiations belts and the South Atlantic Anomaly (check out PROBA2's orbit here). A Carrington Rotation's worth of images are then put together side by side to create an image such as that seen in Figure 1. The black vertical stripes that occaisionally appear in the synoptic maps indicate missing data created by Calibration and off-pointing campaigns.
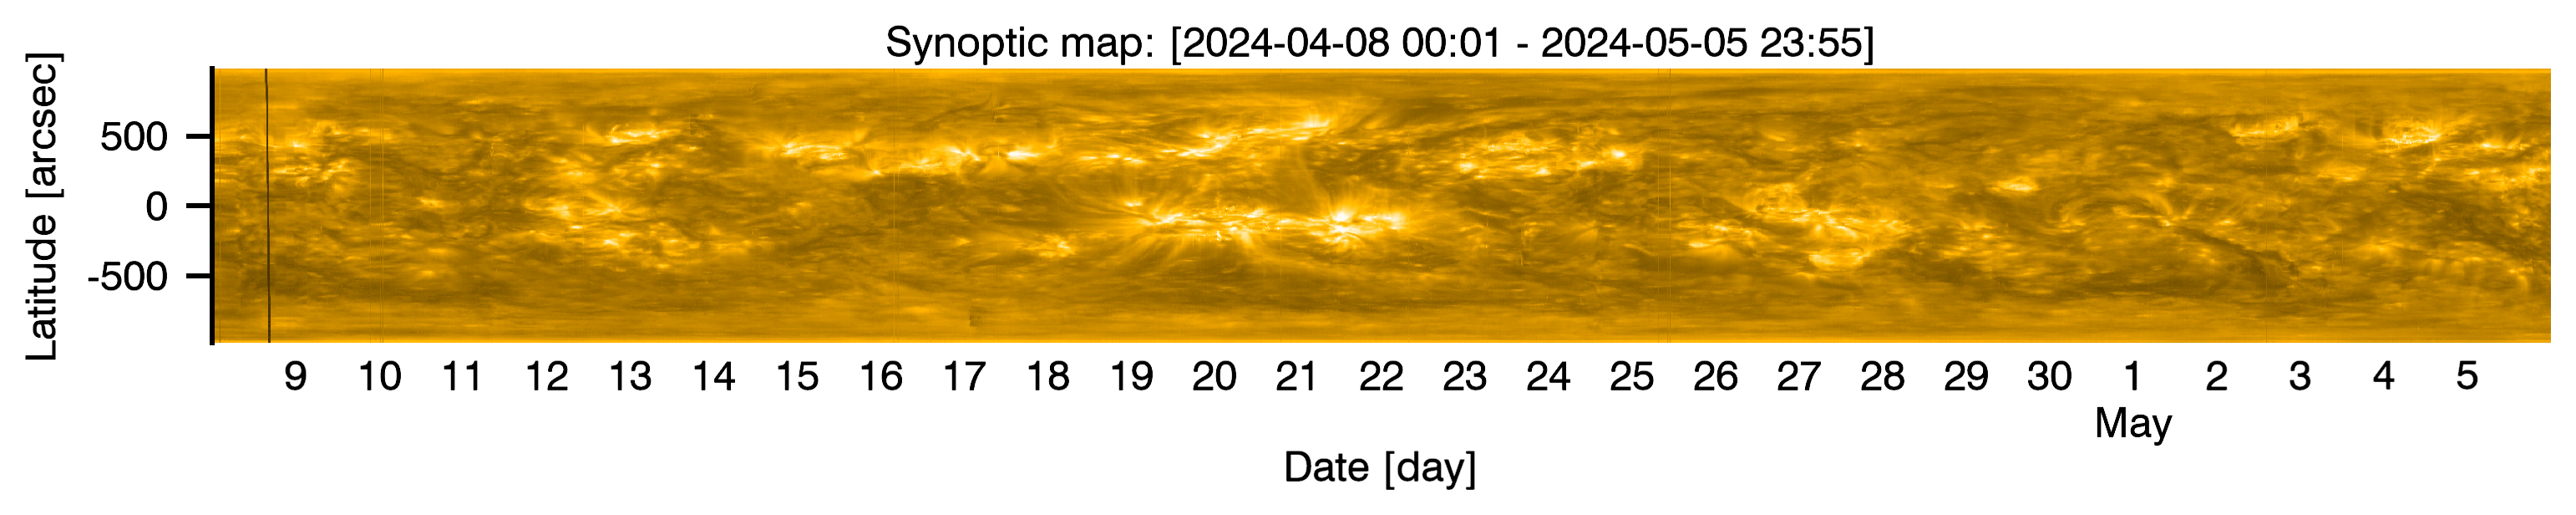
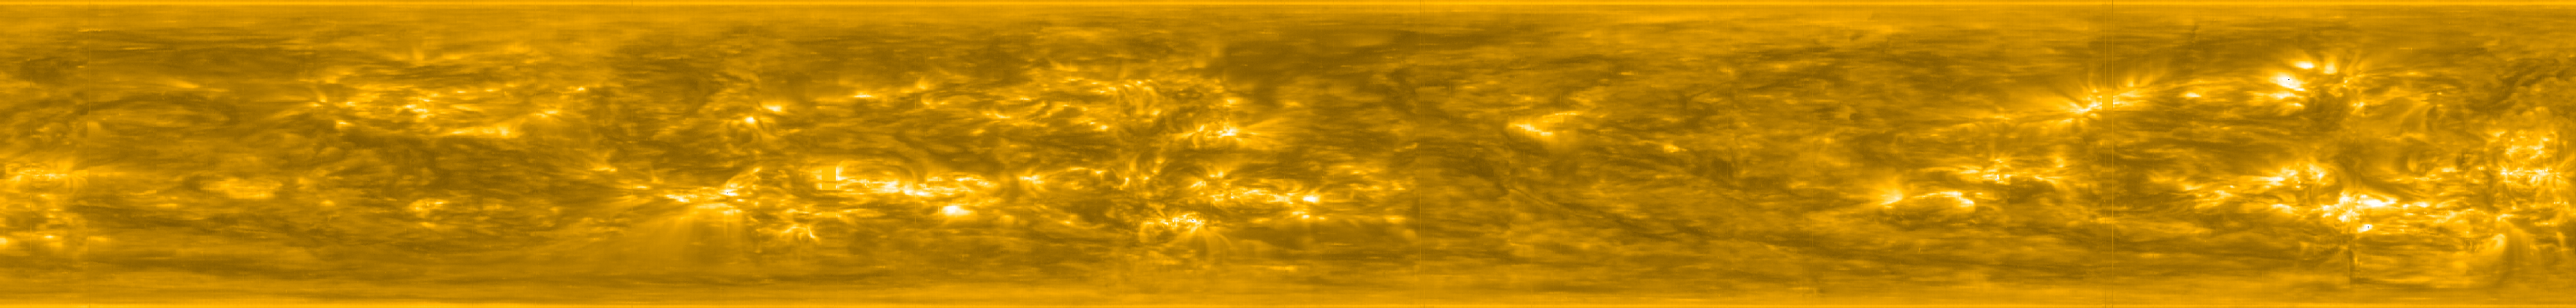
The latest Images can be found with a border here, and without a border here. The horizontal axis in the images with a border shows the time in the format [Month; days] and the vertical axis represents the helioprojective latitude in arcseconds. For a description of coordinate system see Thompson (2006).
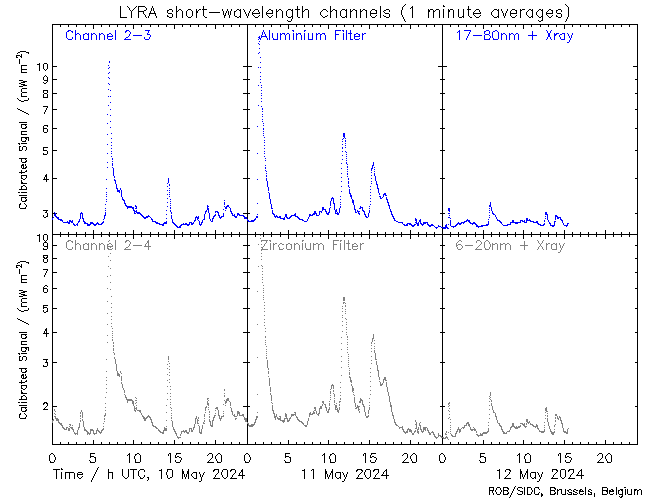
LYRA Latest
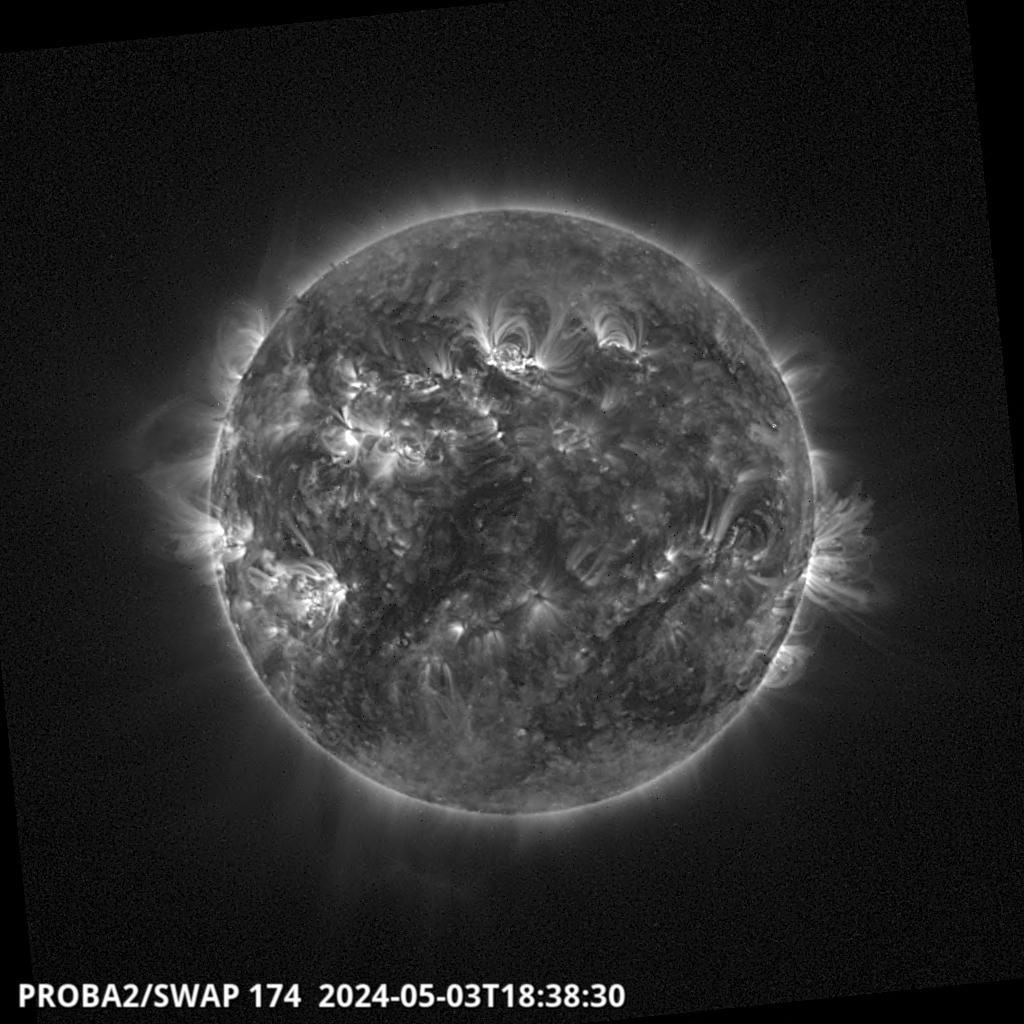
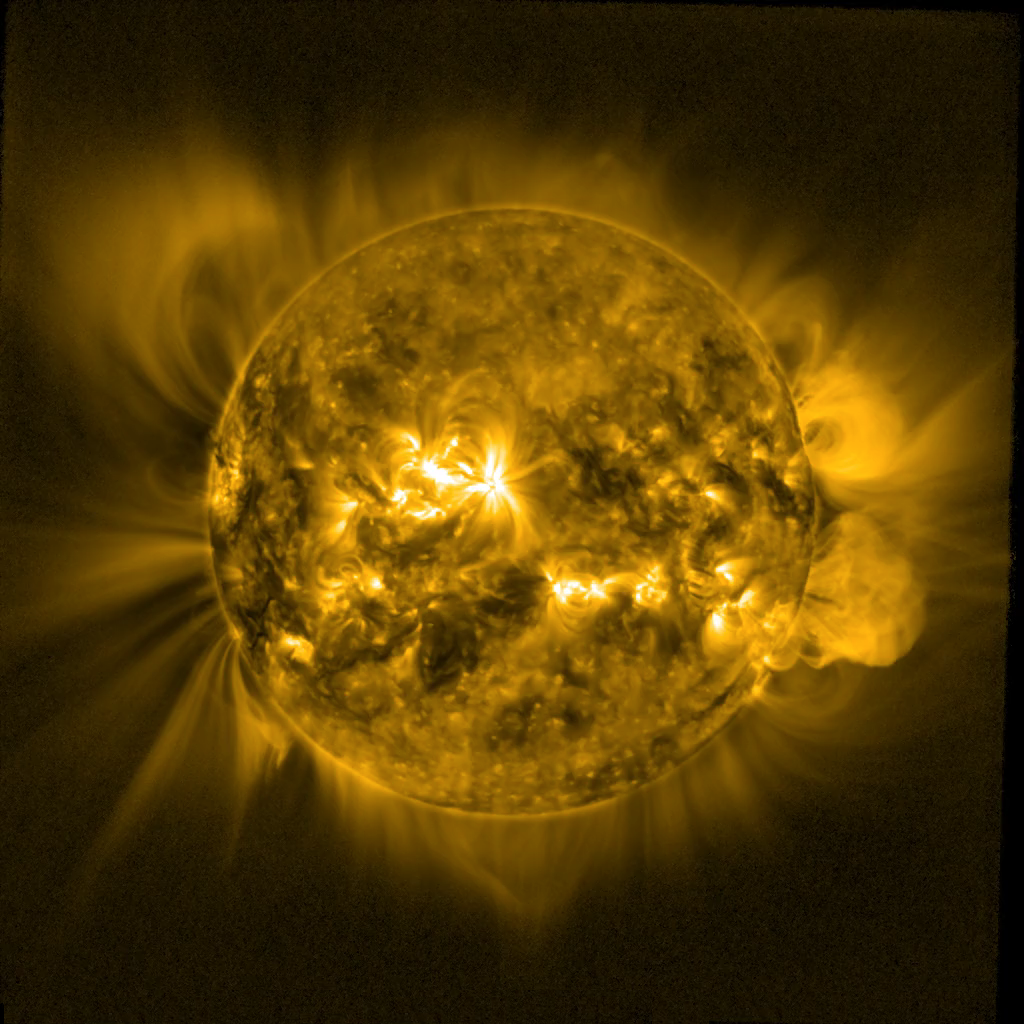
SWAP Latest
Carrington Rotation Movie Latest
SWAP Synoptic Image
SWAP Polar Image