If you do not see any SWAP images above please adjust your browser security settings for this page to allow for mixed content
(both http and https in the same page)
(both http and https in the same page)
| Date | Start | Peak | Stop | Flare class | Location | NOAA region |
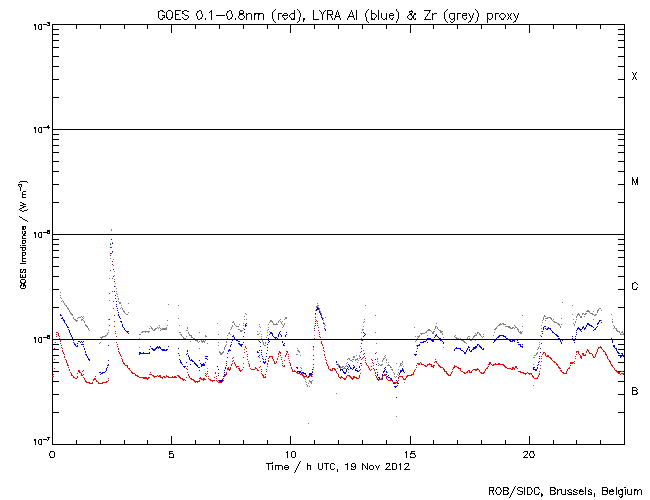
| 2012-11-19 | 10:55:00 | 11:04:00 | 11:15:00 | C1.4 | // | 1610 |
| 2012-11-19 | 02:20:00 | 02:28:00 | 02:31:00 | C7.0 | // | 1618 |
| 2012-11-19 | 00:02:00 | 00:12:00 | 00:25:00 | C1.1 | // | 1619 |
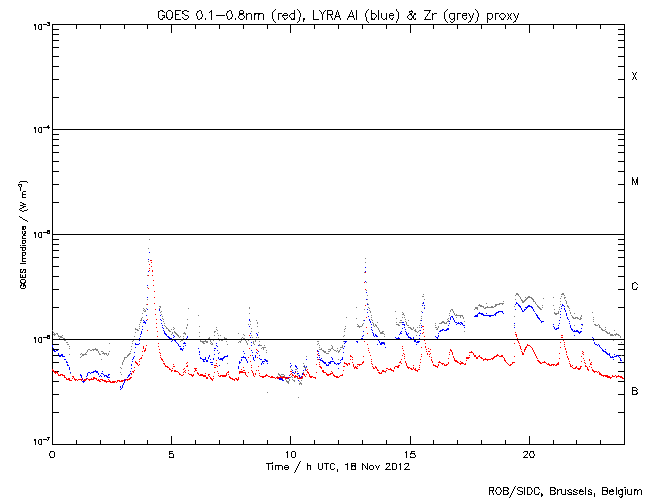
| 2012-11-18 | 21:16:00 | 21:23:00 | 21:30:00 | C1.0 | // | 1618 |
| 2012-11-18 | 19:21:00 | 19:26:00 | 19:37:00 | C1.1 | // | // |
| 2012-11-18 | 15:28:00 | 15:32:00 | 15:37:00 | C1.3 | // | 1618 |
| 2012-11-18 | 13:03:00 | 13:07:00 | 13:09:00 | C4.3 | // | 1619 |
| 2012-11-18 | 11:03:00 | 11:07:00 | 11:12:00 | B7.6 | // | 1619 |
| 2012-11-18 | 08:11:00 | 08:15:00 | 08:18:00 | C1.0 | // | 1613 |
| 2012-11-18 | 03:55:00 | 04:07:00 | 04:15:00 | C5.7 | N08W07 | 1615 |
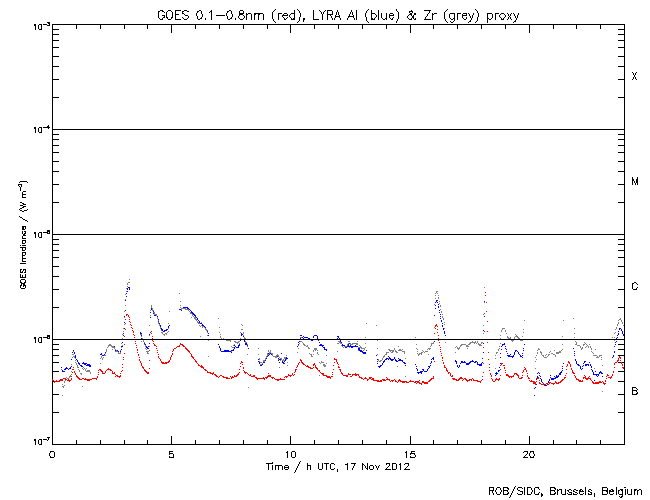
| 2012-11-17 | 18:02:00 | 18:10:00 | 18:14:00 | C2.8 | // | 1613 |
| 2012-11-17 | 15:58:00 | 16:06:00 | 16:15:00 | C1.3 | // | 1618 |
| 2012-11-17 | 04:55:00 | 05:22:00 | 05:44:00 | B9.1 | // | 1610 |
| 2012-11-17 | 04:02:00 | 04:08:00 | 04:23:00 | C1.2 | // | 1613 |
| 2012-11-17 | 02:59:00 | 03:08:00 | 03:23:00 | C1.7 | N08W07 | 1615 |
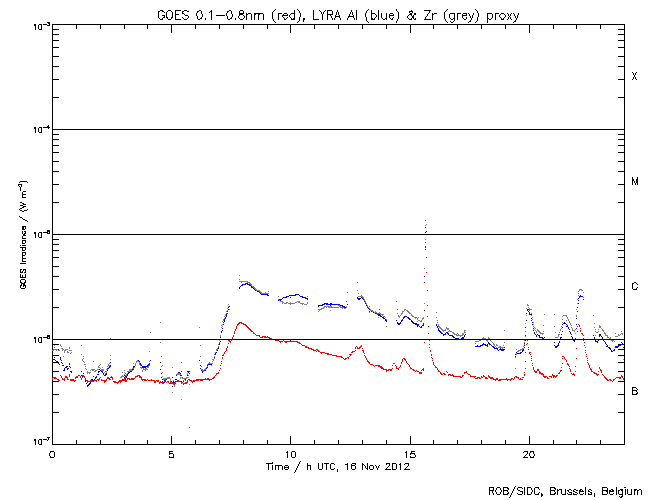
| 2012-11-16 | 21:55:00 | 22:04:00 | 22:19:00 | C1.4 | N18E05 | 1614 |
| 2012-11-16 | 19:49:00 | 19:55:00 | 20:01:00 | C1.0 | // | 1610 |
| 2012-11-16 | 15:34:00 | 15:39:00 | 15:42:00 | C8.4 | // | 1618 |
| 2012-11-16 | 14:44:00 | 14:47:00 | 15:03:00 | B6.8 | // | 1614 |
| 2012-11-16 | 06:41:00 | 07:51:00 | 10:21:00 | C1.4 | // | 1613 |
Lines indicated in yellow correspond to events on the (non-visible) backside of the sun.
If it is available, a detail of the event can be seen by clicking on the table row.