Main menu
You are here
NOAA 1515 takes the center stage
NOAA 1515 appeared at the southeastern solar limb on June 27th. With a maximum sunspot area of only about 5 times the total surface of the Earth, it certainly did not become the biggest sunspot group so far this solar cycle.
Nonetheless, the group was quite complex and showed interesting dynamics. For example, the images underneath taken by SDO/HMI ( http://sdo.gsfc.nasa.gov/ ) on 1 and 2 July show the splitting of the main spot in less than 24 hours! Cytokinesis of solar proportions!

Over the next two days, the split-off sunspot moved towards and into the middle portion of the sunspot group. Crashing into these sunspots, this inevitably resulted in numerous medium class solar flares. The daily sunspot images underneath were taken on 1-8 July by the Uccle Equatorial Table (USET) (http://www.sidc.oma.be/uset/index.php ) in white light. Superimposed on these images are the locations of the 30 M-flares (and 1 X-flare) that were produced by NOAA 1515. Clearly, one can see two regions of flare activity. The first one is to the west and south of the main spot. This region was active during most of the group's transit. The second flare-active region is in the middle portion and only became active after the split-off sunspot bumped into the middle portion (4 July and later).

On July 5th, the Sun produced 10 M-flares: 9 from NOAA 1515, and 1 from NOAA 1519. Though this is quite a lot for one day, the figure pales compared to the record 16 M-flares that were produced on 11 July 1982. That's 2 medium flares every 3 hours!
Obviously, the week from 2 to 8 July 2012 was also very flare-active, with 34 M- and 1 X-flare. One has to go back to March 1991 to get comparable figures. Not surprisingly, the week record dates back from July 1982, when -according to NOAA statistics- from 8 to 14 July 65 M- and 3 X-flares were produced! NOAA 1515 produced 5 high energetic flares (M5 or stronger) during its transit. Underneath images show 4 of these events: the M5.6 from 2 July, the M5.3 from 4 July, the M6.1 from 5 July, and the X1.1 from 6 July. For each event, the pre-flare magnetogram is shown (SDO/HMI and GONG), as well as the outlook during maximum flare intensity (PROBA2/SWAP and GONG), and in H-alpha 15 minutes after the flare's peak (GONG - http://halpha.nso.edu/ ). Event 1 and 4 took place near the group's main spot, while event 2 and 3 were located in the group's middle portion. The H-alpha images for the first 3 events also show dark ejected material over the solar disk. The fifth event, an M6.9 flare from 8 July, is discussed further below.

As noted in a previous comment, NOAA 1515 produced 5 high energetic events during its transit. The last of these events was an M6.9-flare on July 8th that occurred while NOAA 1515 was already close to the western solar limb.
The flare started at 16:23UT and reached its maximum x-ray intensity at 16:32UT. The images underneath show the eruption as seen by PROBA2/SWAP ( http://proba2.oma.be/ ) and in H-alpha ( http://halpha.nso.edu/ ) during the flare's peak and at 16:54UT. One can clearly see that material is ejected from the blast site.

When the clouds of ejected particles are traveling through the Sun's hot atmosphere (the corona), radio wave disturbances are created that can be recorded with ground-based radio-telescopes. This is an observing branch to which both professional as non-professional observers contribute. The image underneath shows the radio spectrum from the Humain Radioastronomy Station ( http://sidc.oma.be/humain/index.php ) as it was recorded between 16:15 and 16:45UT. In a radiospectrum, the intensity of a series of frequencies (Humain: between 45 and 445 MHz) is quickly and continuously scanned for these disturbances.
Underneath the Humain recording is also a graph obtained by Felix Verbelen, leader of the Belgian Radioastronomy Section of the Vereniging Voor Sterrenkunde ( http://www.vvs.be/werkgroepen/werkgroep-radioastronomie ). Monitoring at only one frequency (49.9 MHz: the green line on the Humain's radiospectrum), this radio-telescope is a lot more sensitive than the one from Humain.
Nonetheless, both diagrams show the 3-stage-eruption very well: A type III radio-storm between 16:23 and 16:28UT, a type II storm between 16:30 and 16:36UT (at the peak of the solar flare), and a small disturbance around 16:42UT (barely visible in the Humain recording). It should be noted that the M6.9-flare occurred after the Humain station stopped tracking the Sun, and that at that time the antenna was put back at meridian (storage position).

Finally, the PROBA2-team combined images from 3 satellites (PROBA2, SDO and SOHO: http://sohowww.nascom.nasa.gov/ ) into a movie showing the flare and the subsequent CME as it traveled through the Sun's corona. The movie can be seen at http://proba2.oma.be/swap/data/mpg/movies/campaign_movies/2012_07_07_10_... . Underneath are 3 stills from this clip. The first image shows the flare at 16:38UT, with material visibly leaving the solar surface. The second image was taken around 18:50UT, clearly showing how the solid CME from the flare is leaving the Sun. Interestingly, the third image taken around 22:10UT, shows that a second CME was hurled into space. The particle cloud originated from the eruption of the trans-equatorial coronal arch visible in the first two images. Amazingly, the arch would reshape itself a few hours later and remained visible for another two days!

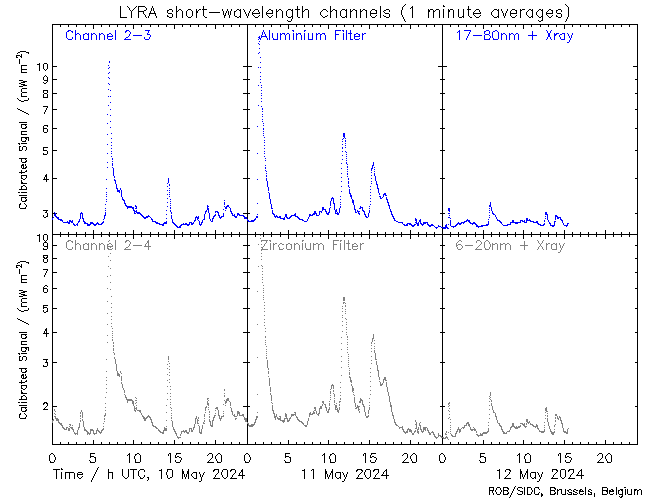
LYRA Latest
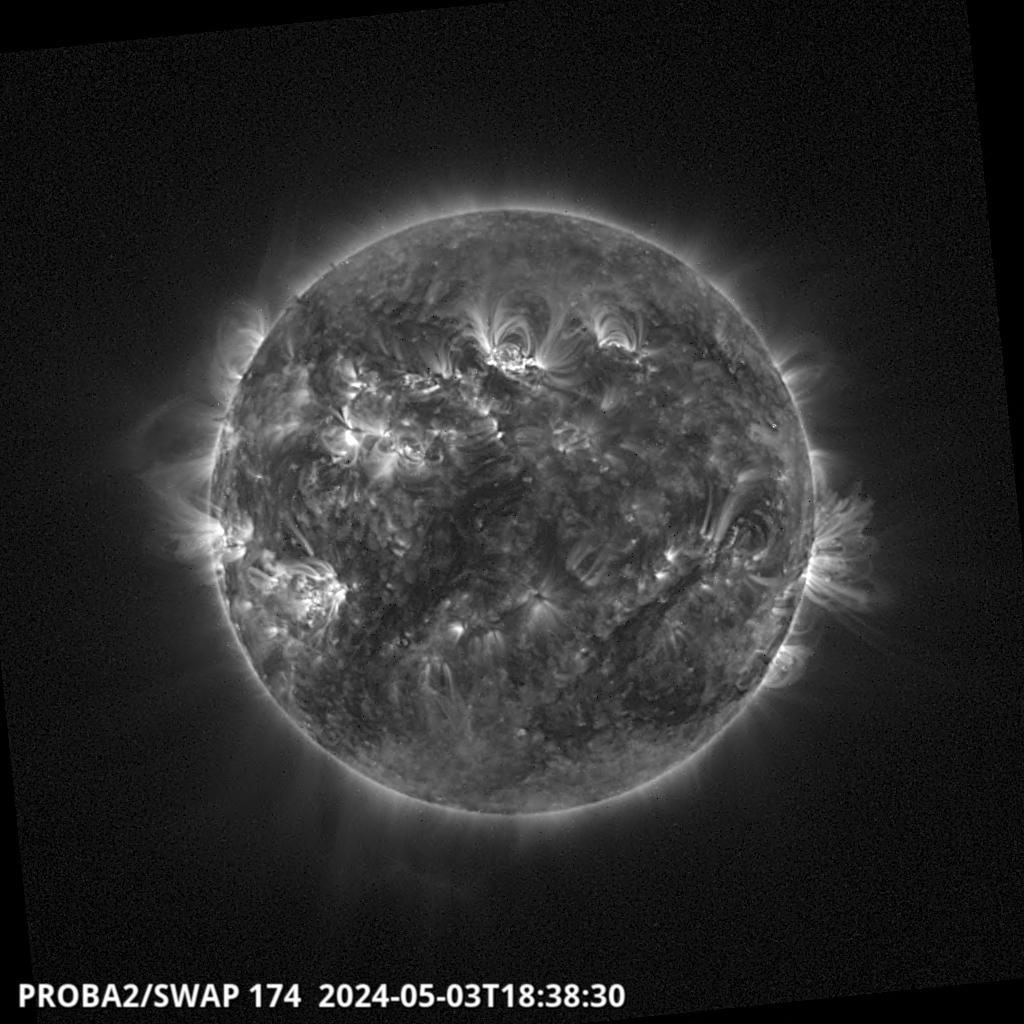
SWAP Latest
Carrington Rotation Movie Latest
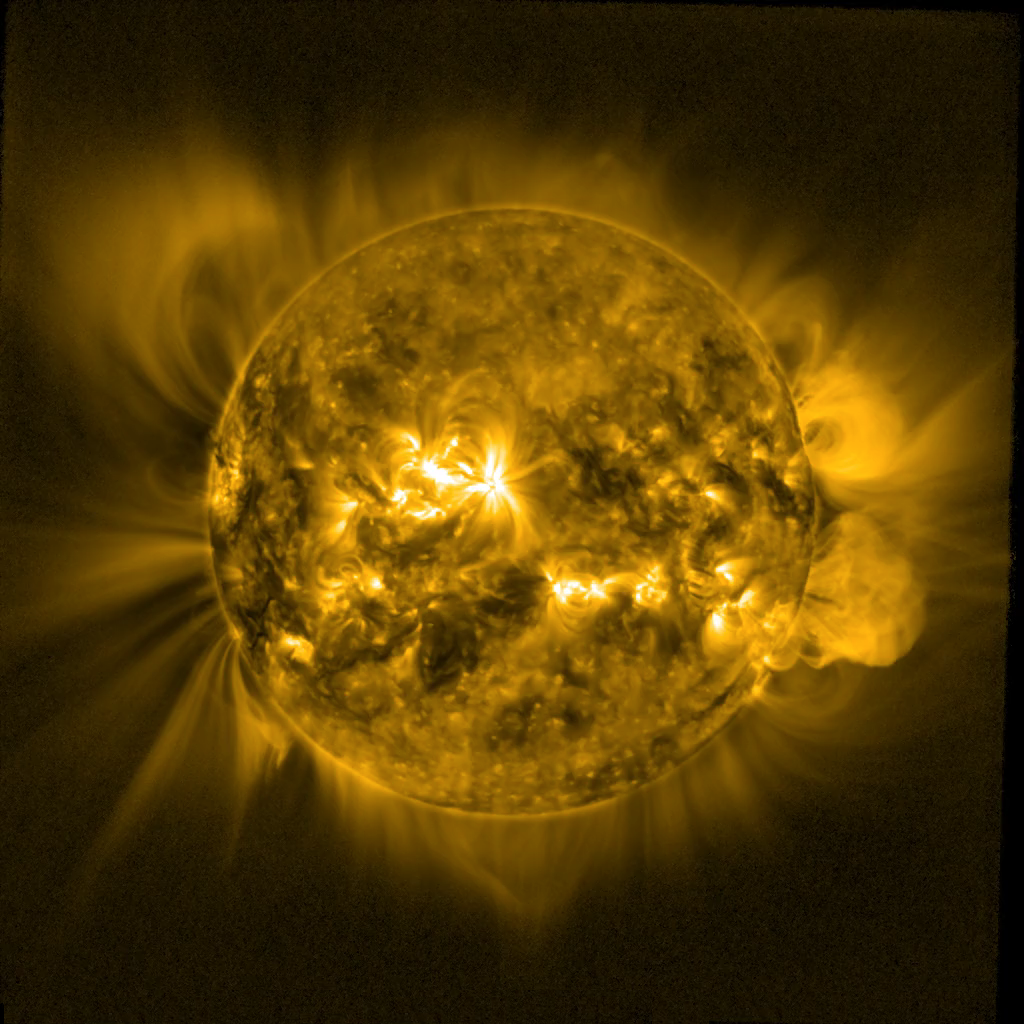
SWAP Synoptic Image
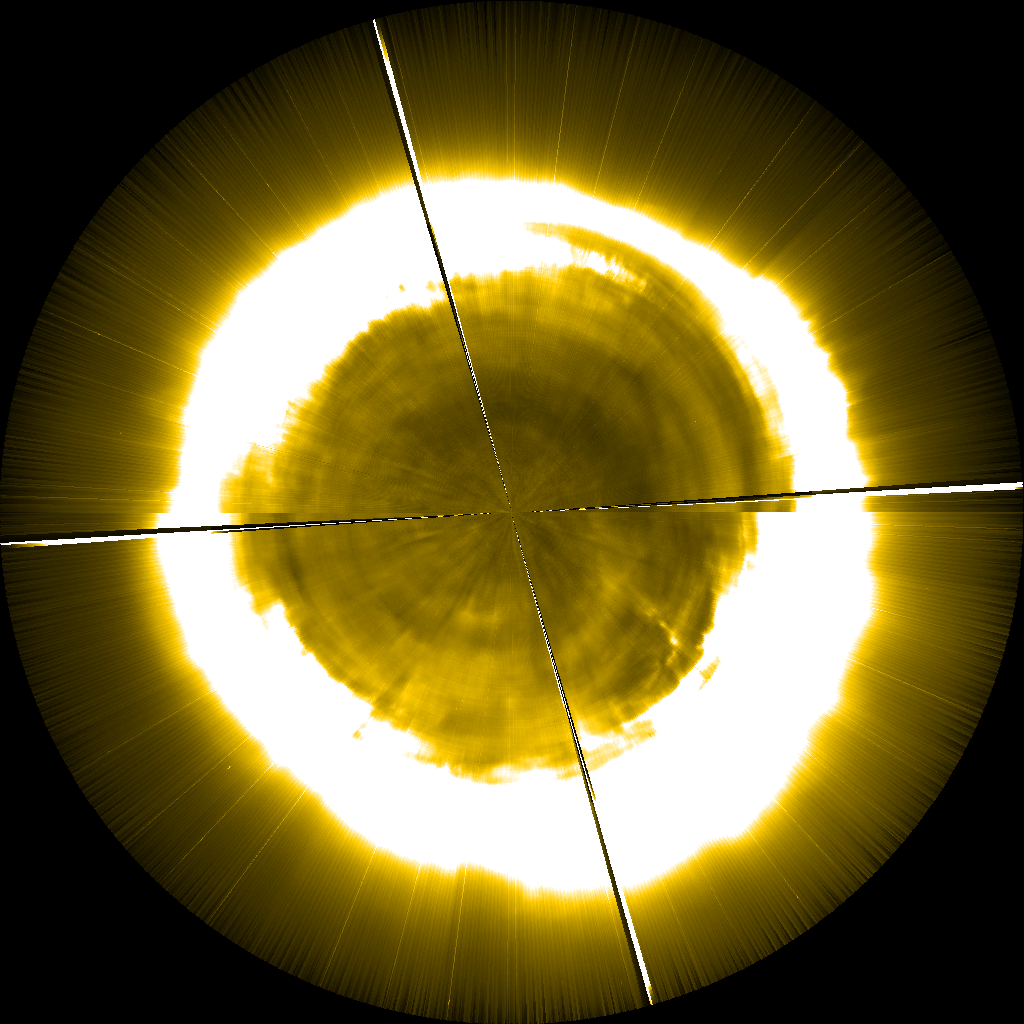
SWAP Polar Image