Main menu
You are here
Using the SpoCA segmentation suite to track long term variations in EUV observations
 A recent paper by Verbeeck, C. et al. entitled "The SPoCA-suite: Software for extraction, characterization, and tracking of active regions and coronal holes on EUV images", in the journal Astronomy & Astrophysics, discusses a new software suite that can be used to track and segment different regions of the Sun from EUV images.
The SPoCA-suite: Software uses several segmentation procedures and is able to identify and extract different regions of the Sun using clustering schemes and fuzzy clustering techniques. For more information see the paper and references within.
Within the paper, the segmentation techniques are applied to several EUV imagers, including Sun Watcher using APS and image Processing (SWAP) on board PROBA2. In particular, the segmentation is applied to SWAP data over a portion of the PROBA2 mission lifetime (2010-present). The Software is used to extract Active Region (AR; small areas of bright emission observed in EUV images) areas and compare their size and intensity variation with international sunspot numbers and F10.7 radio fluxes. The results of the data sets are complementary, suggesting that the total intensity of ARs in narrow-band EUV imager channels is a good indicator of solar activity.
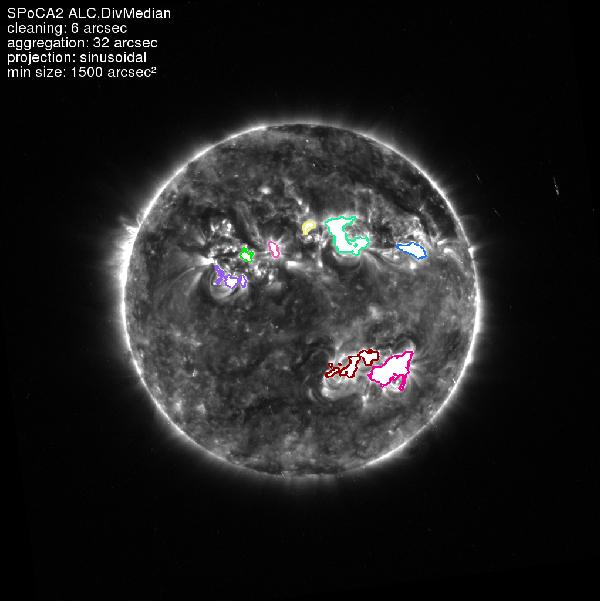
An example of the technique used to highlight and extract AR area and intensity from a SWAP image can be seen in Figure 1 below. Where the AR region areas are clearly outlined.
Figure 1: Overlay of an AR map onto the corresponding SWAP 174 Å image taken on June 5, 2011 around 18h UT (Courtesy of A&A; Figure 11. from A&A 561, A29).
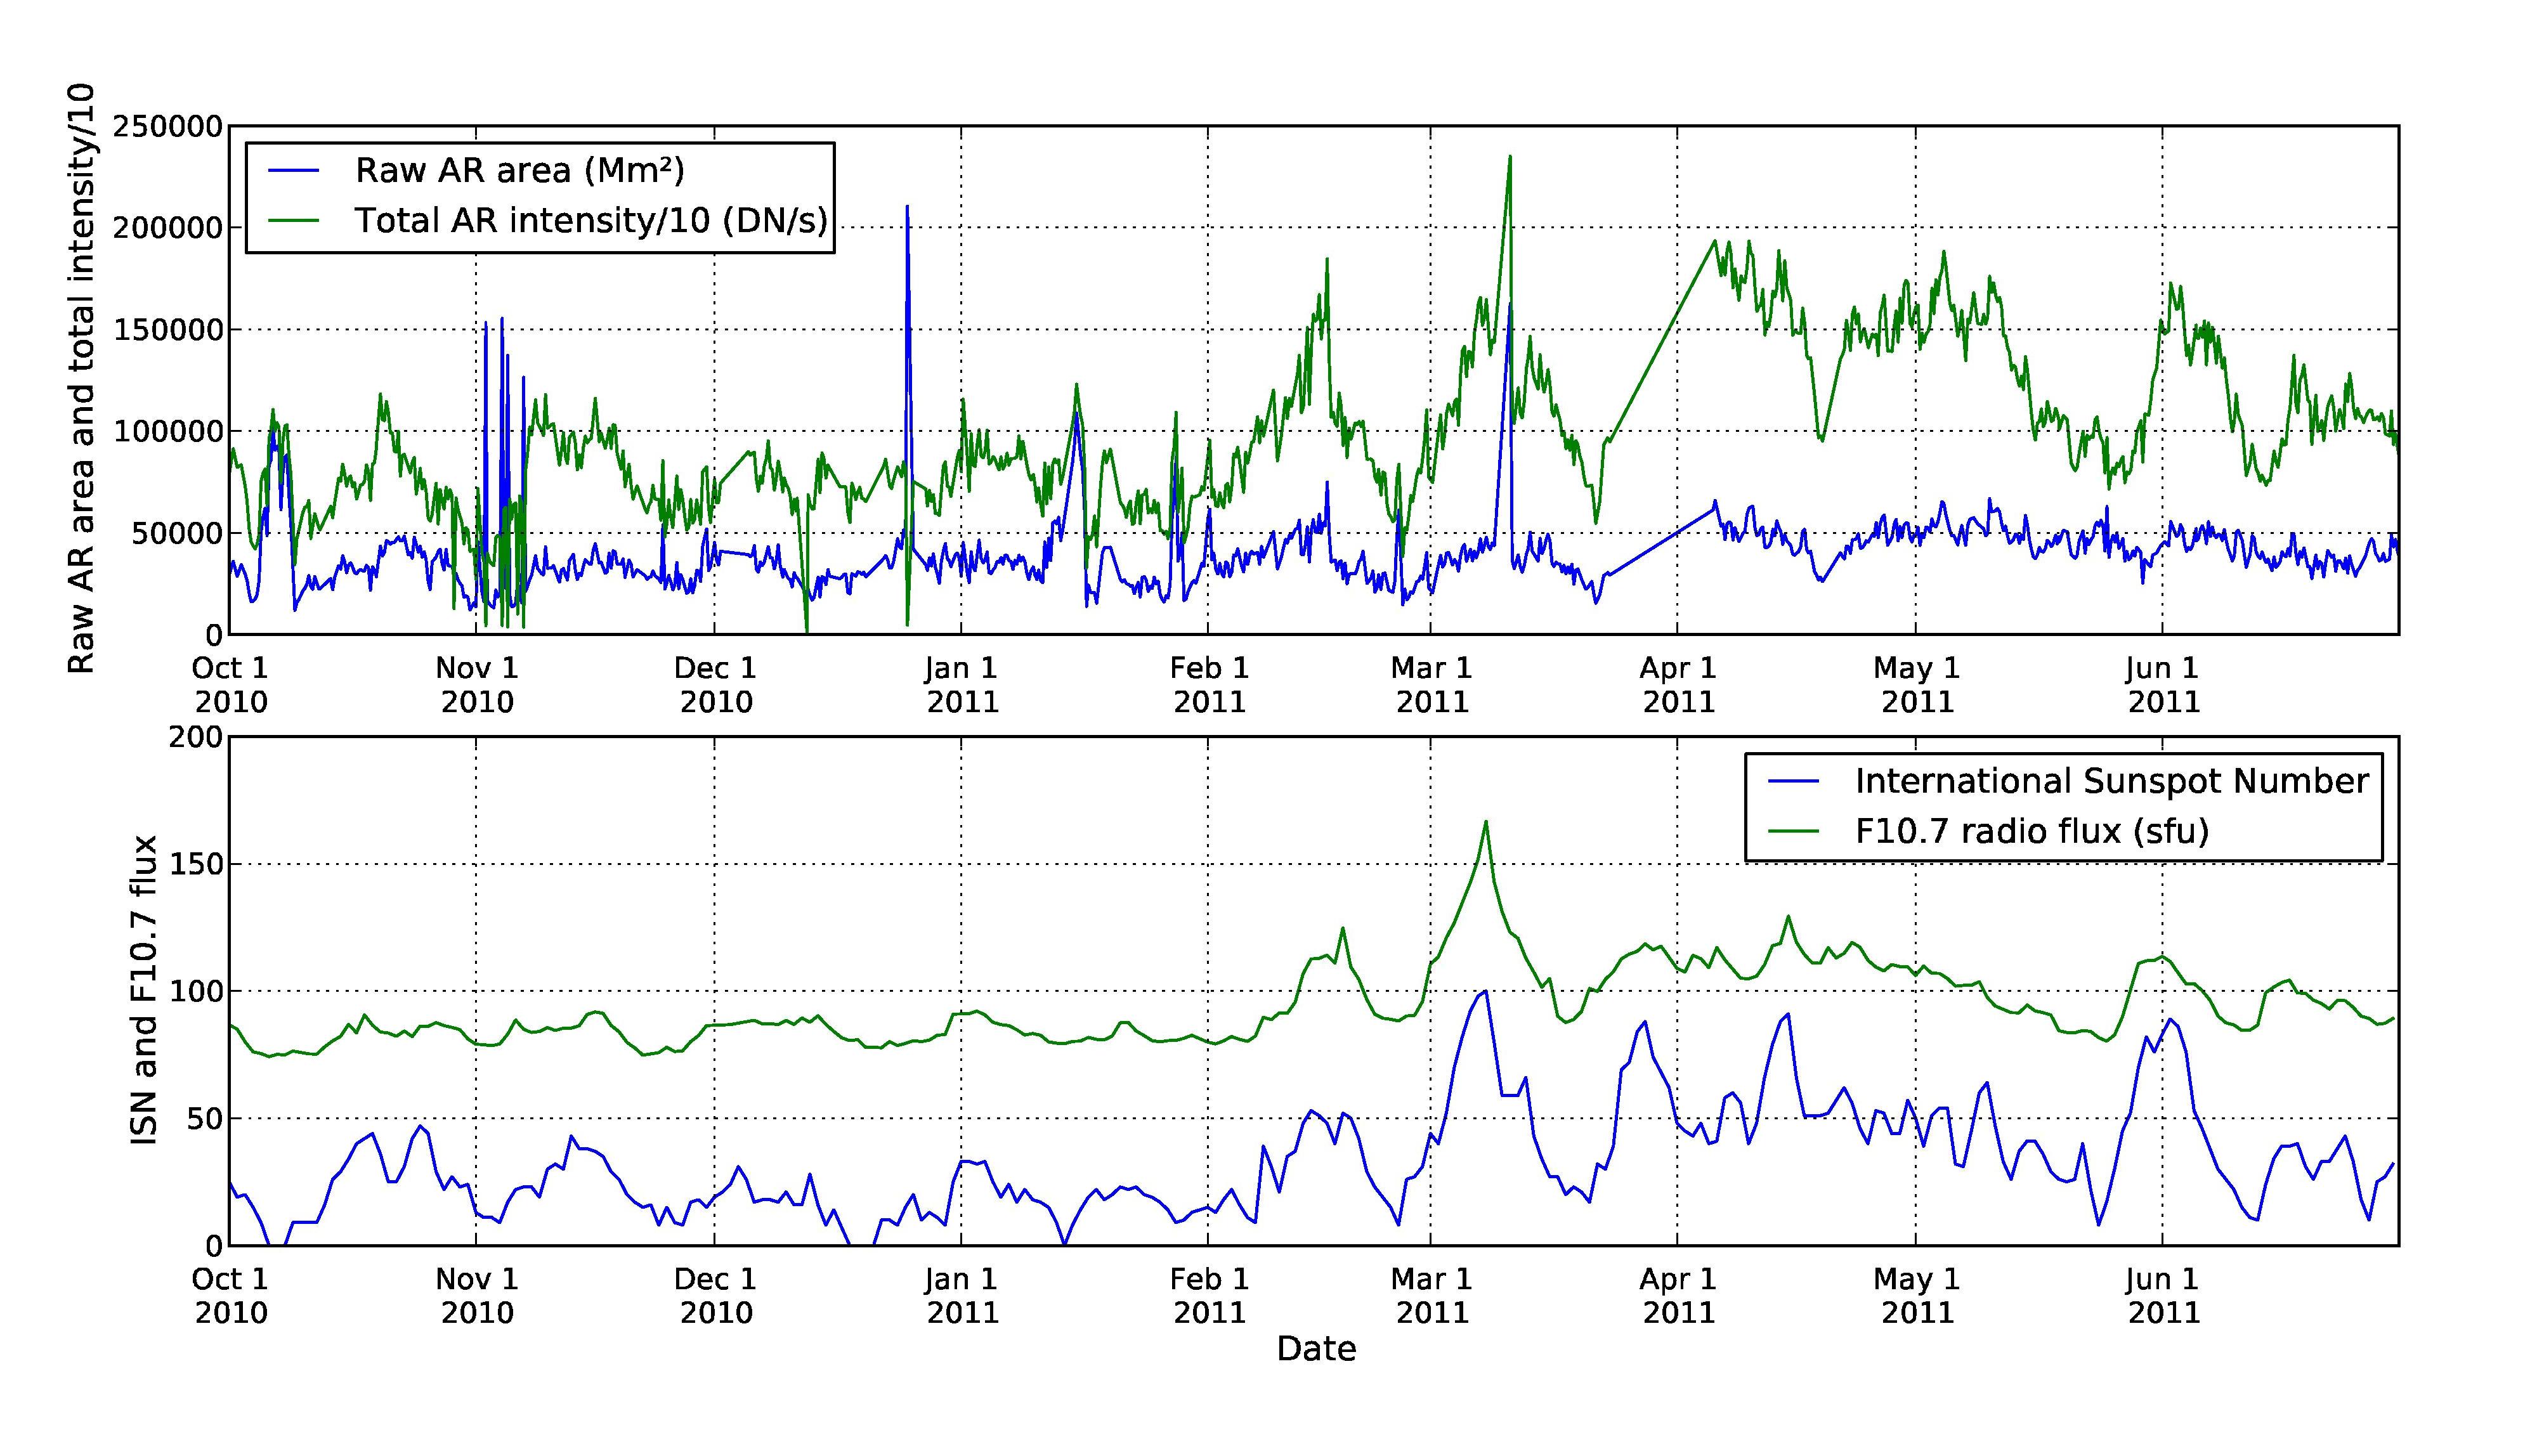
A comparison of Raw AR area and total AR intensity from 174 Å SWAP images and daily International Sunspot Number and F10.7 radio flux from October 1, 2010 to June 30, 2011 can be seen in Figure 2 below.

Figure 2: a) (top) Raw AR area and total AR intensity from 174 Å SWAP images; and b) (bottom) Daily International Sunspot Number and F10.7 radio flux from October 1, 2010 to June 30, 2011 (Courtesy of A&A; Figure 12. from A&A 561, A29).
Kumara, S.T. et al. published a subsequent paper titled: "Segmentation of coronal features to understand the solar EUV and UV irradiance variability" in A&A 561, A9. The authors make use of the SPoCA suite discussed in the paper above. They study the variability of solar irradiance for a period of two years (January 2011-December 2012) using the Large Yield Radiometer (LYRA), the Sun Watcher using APS and image Processing (SWAP) on board PROBA2, and the Atmospheric Imaging Assembly (AIA) on board the Solar Dynamics Observatory (SDO). Kumara et al. use LYRA channel 3 (17–80 nm and a contribution below 5 nm) for comparison, as this channel overlaps the SWAP bandpass (17.4 nm), as well as the main AIA channels (17.1 nm and 19.3 nm) and is expected to show similar short-term variations in solar spectral irradiance (SSI).
By applying SPoCA to two years of AIA and SWAP images Kumara et al. obtain a series of segmented maps. which were used to compute (1) the integrated intensity on SWAP and AIA images, (2) the area occupied by each feature (ARs, Coronal Holes (CHs), and Quiet Sun (QS) regions), and (3) the integrated intensity of these features. The parameters were then compared with the SSI as observed with LYRA channel 3 (observed Sun as a star) average for each day. It was found that ARs are highly correlated with LYRA irradiance measurements. Indicating that the relative AR variations are of the same order of magnitude as the SSI variations. Therefore ARs appear to have a great impact on the irradiance fluctuations, the second highest correlation was found with the integrated intensity. Similarly, the QS appears to be correlated well with LYRA irradiance, but less than that of ARs. Therefore, the QS appeared to influence the irradiance fluctuation, but less than ARs. Finally CHs have a very low correlation, meaning CHs contribute much less to the irradiance fluctuations than the other two.
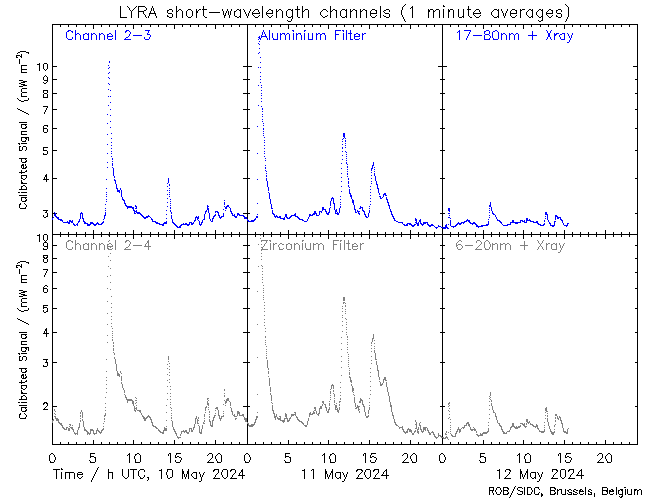
LYRA Latest
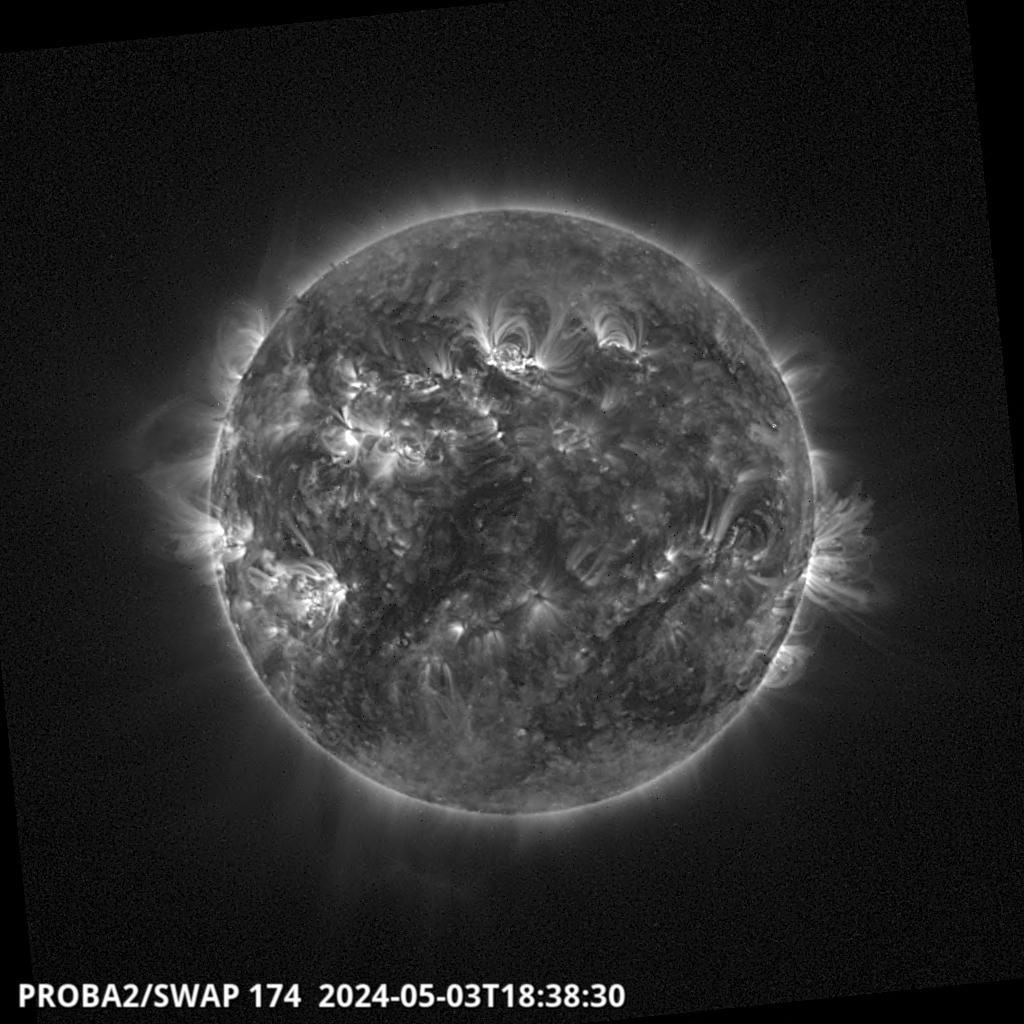
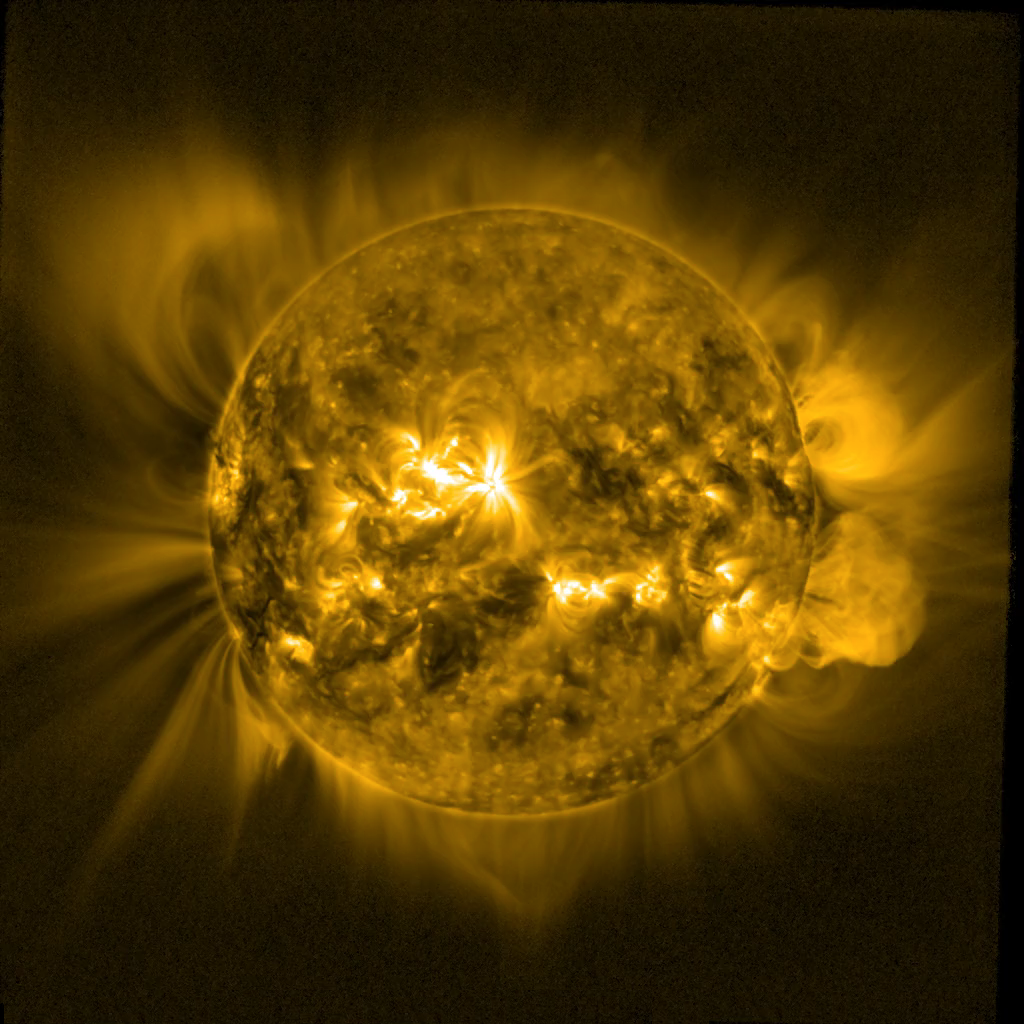
SWAP Latest
Carrington Rotation Movie Latest
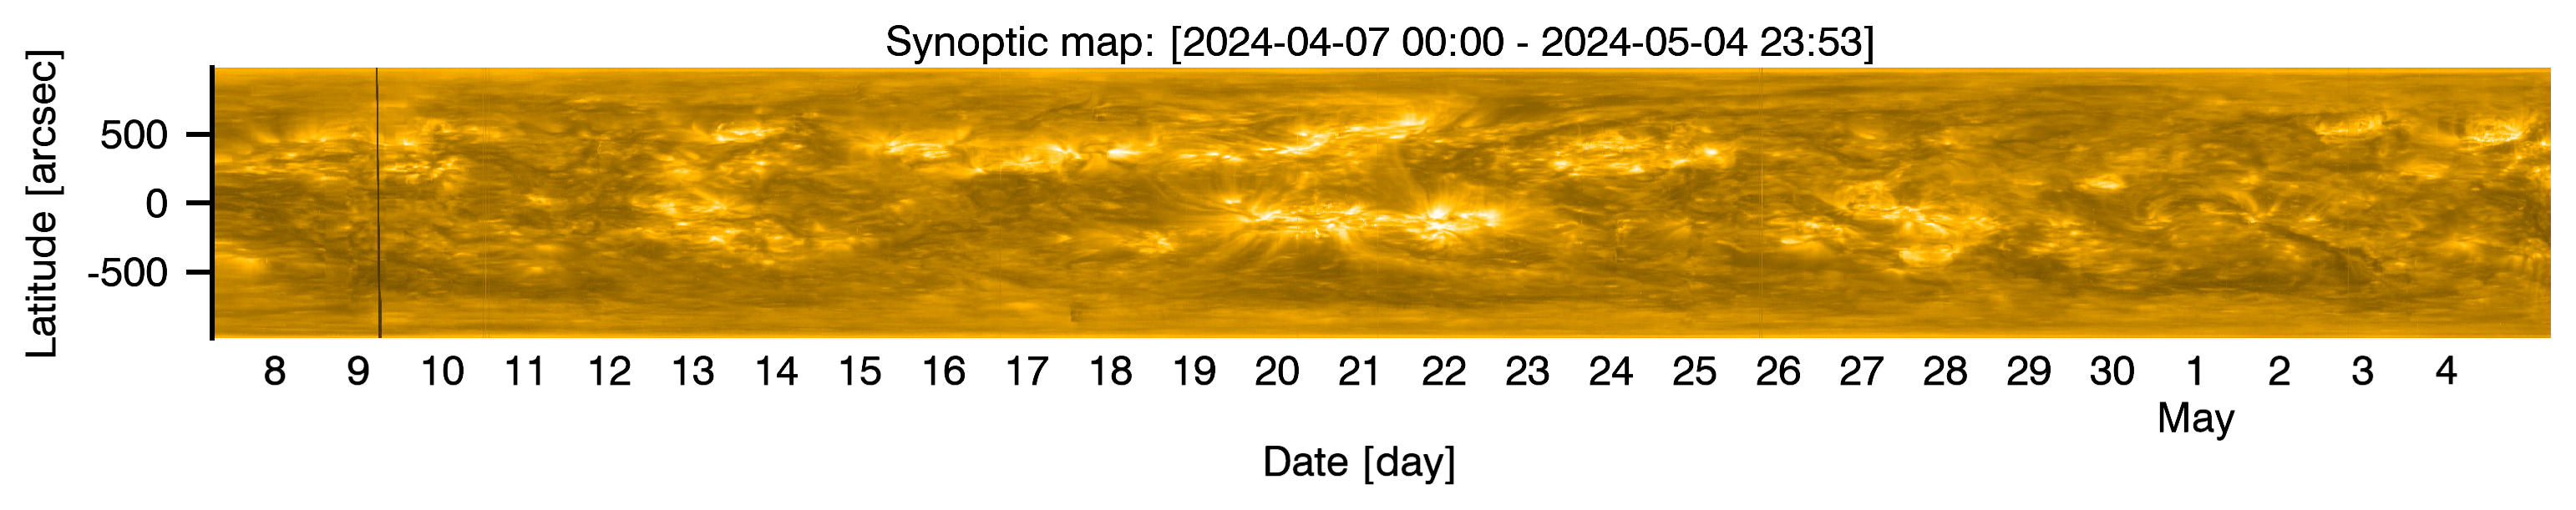
SWAP Synoptic Image
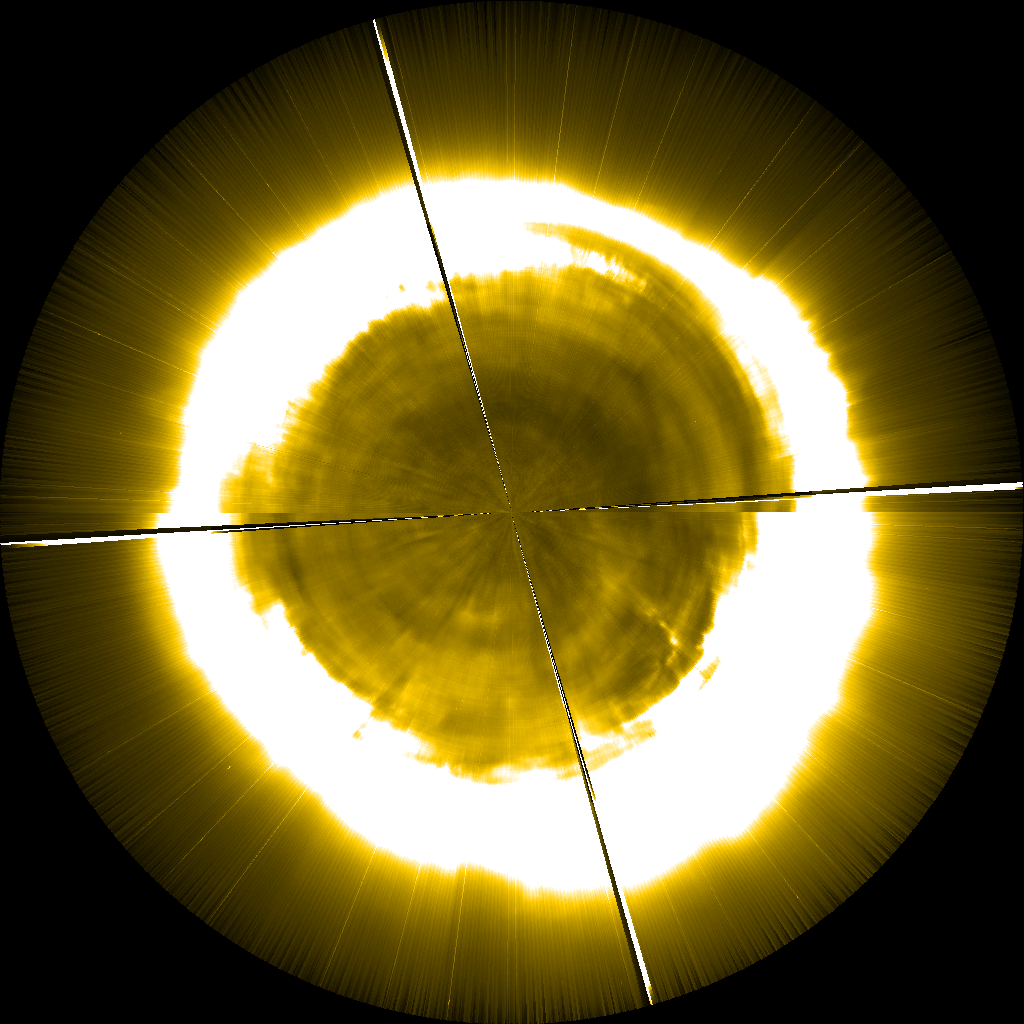
SWAP Polar Image