When observing the Sun for a prolonged period of time, it soon becomes evident that features on its surface, and in its outer atmosphere do not rotate at the same rate. This is because the Sun is not a solid body, but a big ball of magnetised plasma, whose rotation is variable with position and height in the solar atmosphere. One of the most striking observations is that of ‘differential’ rotation, where features on the solar surface and in the solar atmosphere are observed to rotate faster at the equator (rotation period = 25.4 days) when compared to those closer to the poles (rotation period = 36 days). This is evident in observations of sunspots, which have been used as tracers for measuring solar motion for many years.
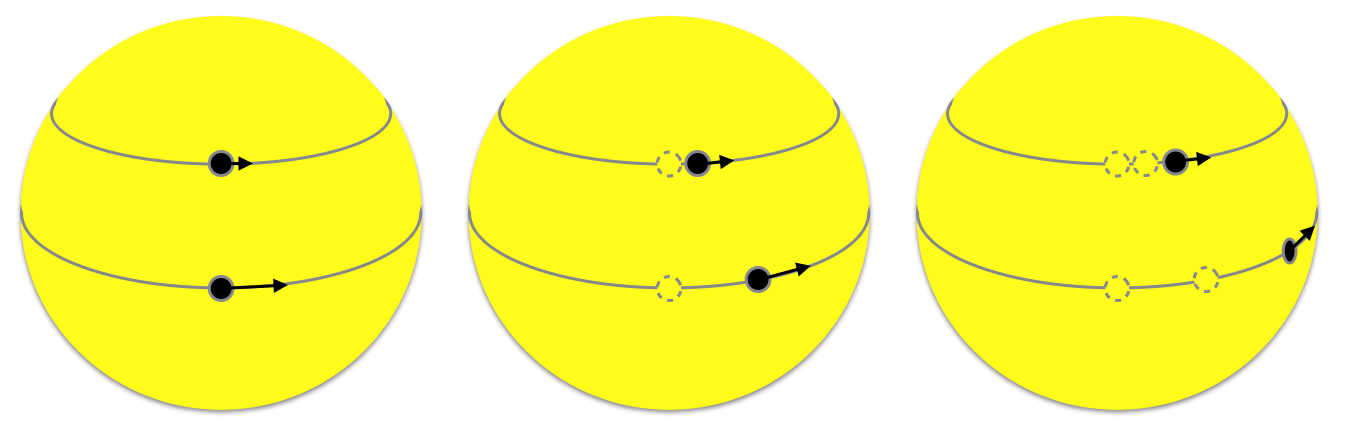
If we consider the highly idealised situation represented in Figure 1, we observe two sunspots positioned along the same line of longitude, but with the first positioned along the equator and the second at a high latitude, over time we would see the first sunspot move faster as the Sun rotates, when compared to the second in the North. This is not just an observational effect, but is linked to the internal magnetic dynamo. For comparison, if we consider the Earth where all positions are fixed (approximately) relative to each other, all its features rotate together. If we consider the Netherlands for example, barring some catastrophic seismic activity, it will be positioned above Belgium over successive Earth rotations. However on the Sun, two features will move apart over time, or maybe erupt, submerge, combine or disappear all together.
Figure 1. Demonstrates how differential rotation causes a feature to rotate faster at the equator when compared to the pole. The image on the left is at an initial time when two sunspots line up along a line of longitude, the middle image is some time later when both sunspots have rotated and the right image is later still when the sunspots have rotated further around the solar disk.
A Carrington Rotation is a period of time chosen to represent one rotation of the Sun, allowing the comparison of features such as sunspot groups or active-regions ( A good description of active-regions can be found here). A period of 27.28 days was chosen to represent a single rotation that largely resembles the recurrence time of features near the equator. The rotation period was initially conceived by Richard Carrington, when he determined the rotation rate of low latitude sunspots. Carrington determined a rotation rate of 25.38 days relative to background stars (sidereal rotation period). However, due to the Earths orbit, this is perceived as 27.28 days from the Earth. Each rotation of the Sun is assigned a Carrington Rotation Number, starting from 09-Nov-1853. That number has now reached 2173 at time of writing (28-Jan-2016)
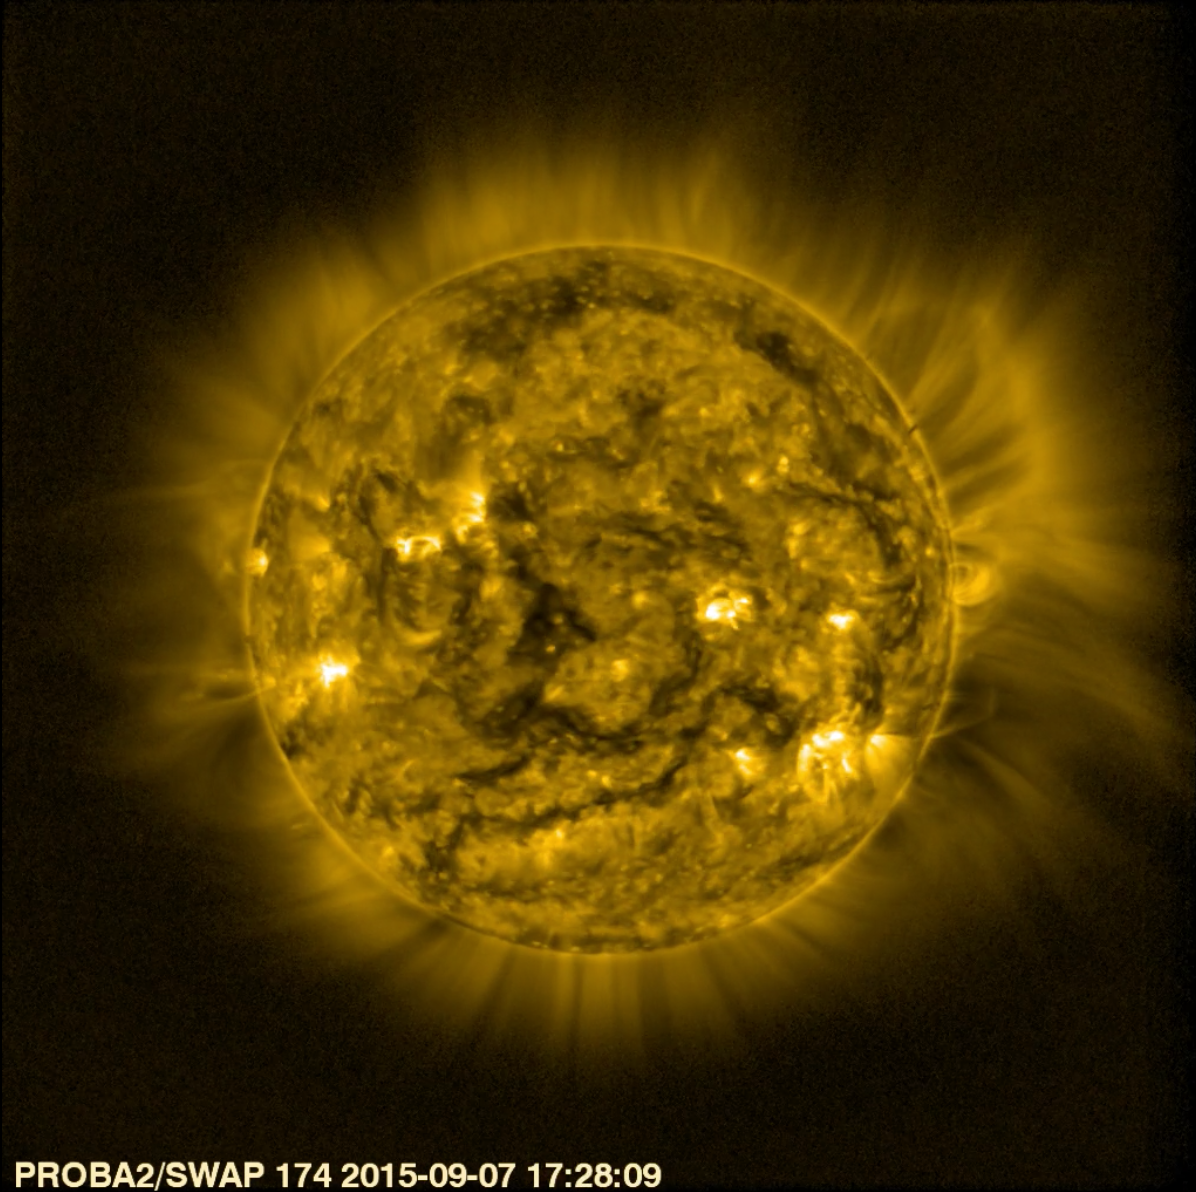
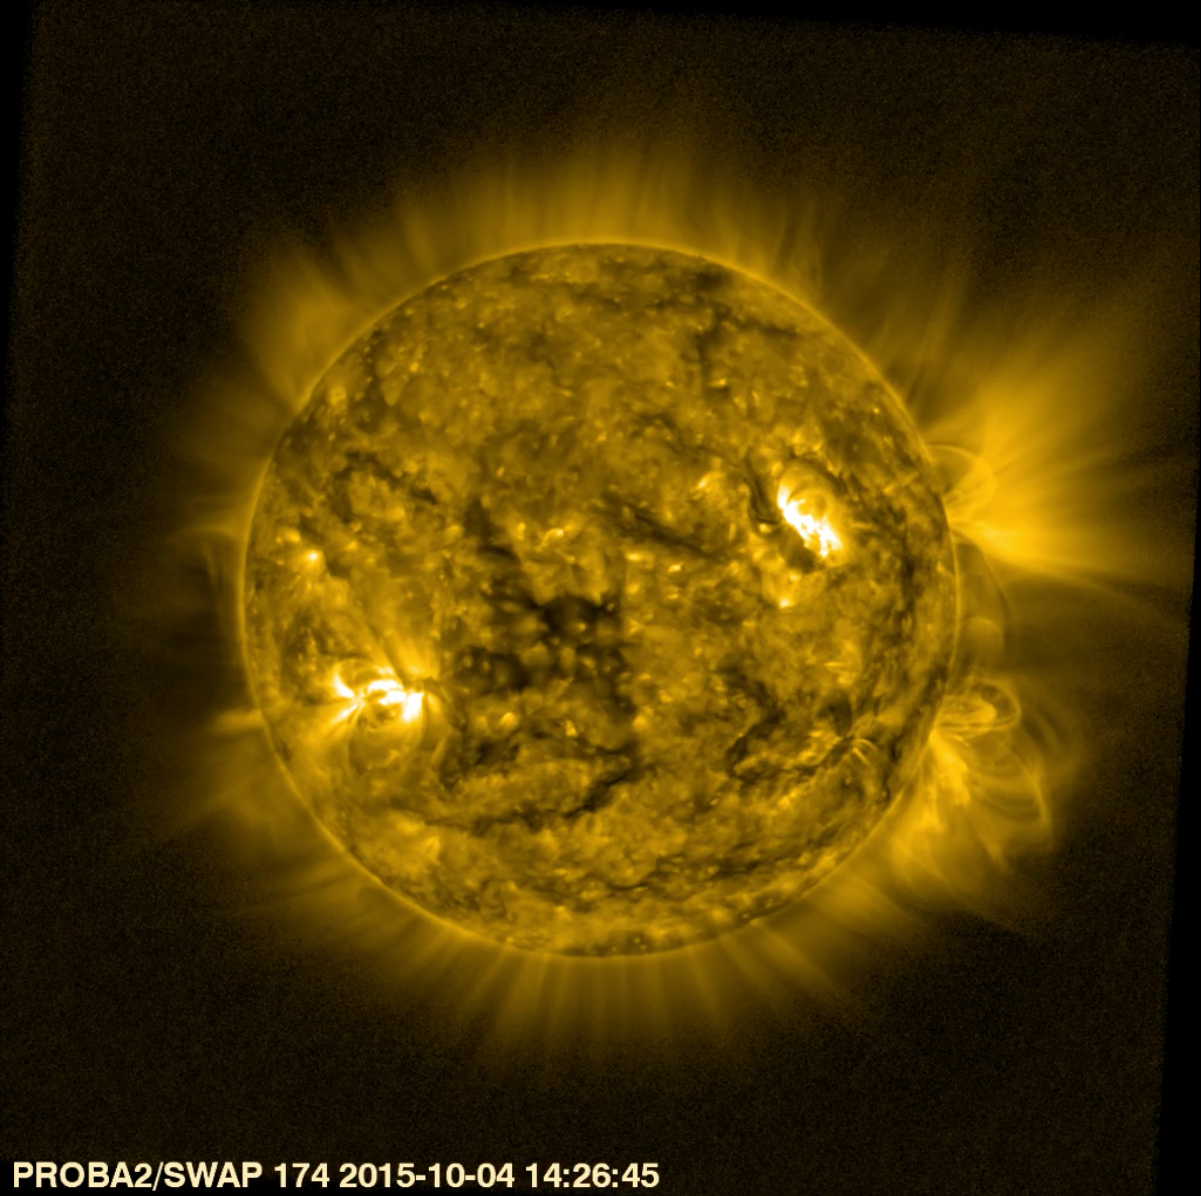
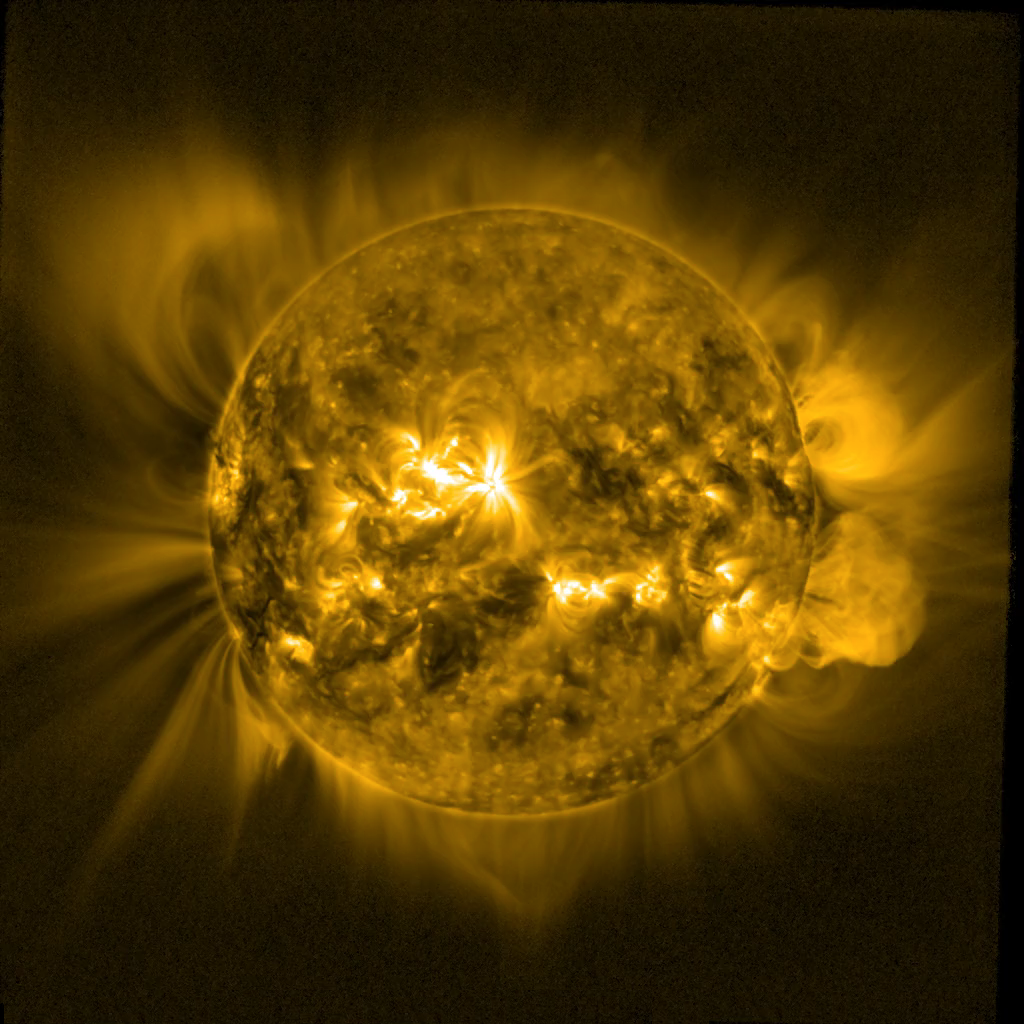
The SWAP EUV imager onboard PROBA2 has been continually monitoring the Sun since early Feb-2010 (Carrington rotation 2093), and has observed 81 rotations in total (at time of writing). Each of these rotations have been turned into a movie and can be found here. Through these observations SWAP has monitored the Suns ever changing face and tracked its evolving features. Figure 2 below compares the Sun at the beginning of Carrington rotation 2168 (07-Sep-2015) to the Sun at the beginning of Carrington rotation 2169 (04-Oct-2015). Through such observations we can see some recurrent features, such as the active-region located in the Sun's Eastern hemisphere (left side of the Sun), the filament channels (dark wiggly lines) in the South, the off-limb cavity in the North-West and the bright structures emerging off of the East limb. The two images also highlight the dynamics of the Sun, with evolving coronal holes and active-regions, in particular the large bright active-region seen in the North-West of the image the right. This region has evolved from the small region located closer to solar disk centre in the image on the left, one Carrington rotation before. Movie 1, below shows one Carrington rotation as seen by SWAP.
Figure 2. Comparing the start of Carrington Rotation 2168 (left; See a movie of Carrington rotation 2168 here) to the start of Carrington Rotation 2169 (right; See a movie of Carrington rotation 2169 here).
Movie 1. SWAP Movie of Carrington rotation 2168
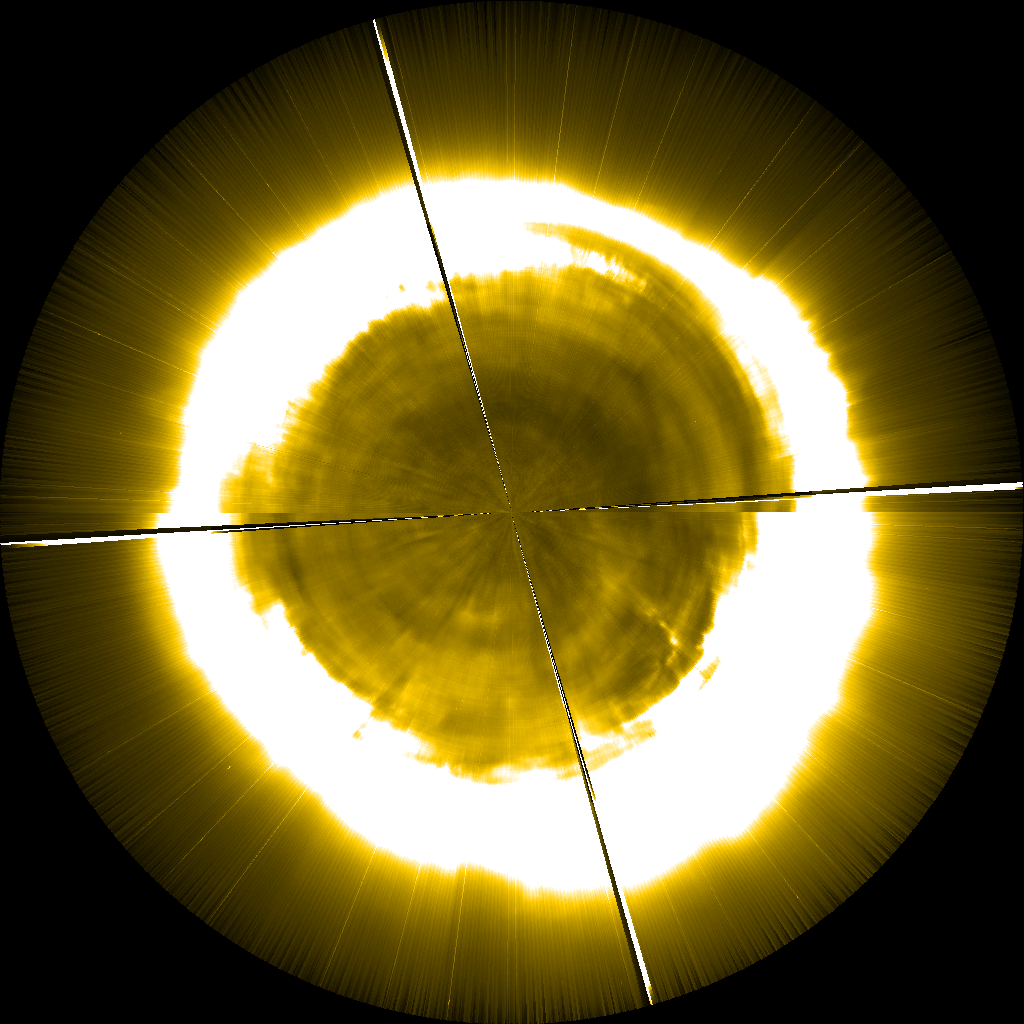
One intriguing aspect of the SWAP Carrington rotation movies is the ability to see the changing large-scale EUV structures located off the solar limb, out to the edge of SWAPs field of view. These structures trace out magnetic field lines, which can be seen due to hot plasmas trapped on them. In a standard SWAP image the signal-to-noise in these regions is too small to distinguish individual structures. However, D. B. Seaton developed an image processing method, that employs image stacking and median filtering techniques to improve the signal to noise and enhance the signatures of structures in these regions. Observations of the evolution of this region of the solar corona would be impossible without SWAPs unique large field of view.
It is well documented that the Sun undergoes an 11 year periodic activity cycle (thats approximately 158 Carrington rotations for those paying attention), often referred to as the solar cycle. Over this period several facets of the Sun's activity are observed to change, including; the number and size of erupting structures, the position of Sunspots, levels of radiation, and the number of flares amongst others. The solar cycle starts from 'solar minimum', a period of low activity period, before rapidly rise and reaching a peak around 3-4 years later, before declining back down to a minimum from which point the next cycle will begin. No two cycles are exactly the same, with variations in length, magnitude of activity, and sometimes double peaks being observed. Although understanding the driving forces behind the solar cycle is still being studied, one thing that can be agreed upon is that all features are driven by the Suns evolving internal magnetic field, which is linked to all activity seen at the surface.
The current solar cycle (No. 24) has been conspicuous by its low levels of activity compared to previous solar cycles, with several observers initially wondering if this was to be the weakest solar cycle ever observed. Some even speculated that it may rival the Maunder Minimum, a period of exceptionally low activity observed from around 1645 and continuing to about 1715. In the end activity did increase, but the cycle has proved to be one of the weakest cycles observed since records began. The cycle began at the beginning of 2008, but there was little activity observed until early 2010. It exhibited two peaks in activity, firstly in 2011 and then again in 2014 and is currently in its declining phase.
PROBA2 has been observing the Sun for more than half a solar cycle, commencing observations in 2010 when activity of solar cycle 24 started in earnest. The SWAP EUV imager has not only monitored the solar disk, but also monitored changes in the large scale off-limb magnetic structures, which can be seen to vary throughout the solar cycle. This can easily be seen by examining different Carrington rotation movies throughout the mission. Some observations of these changes were reported and discussed in Seaton et al. 2013.
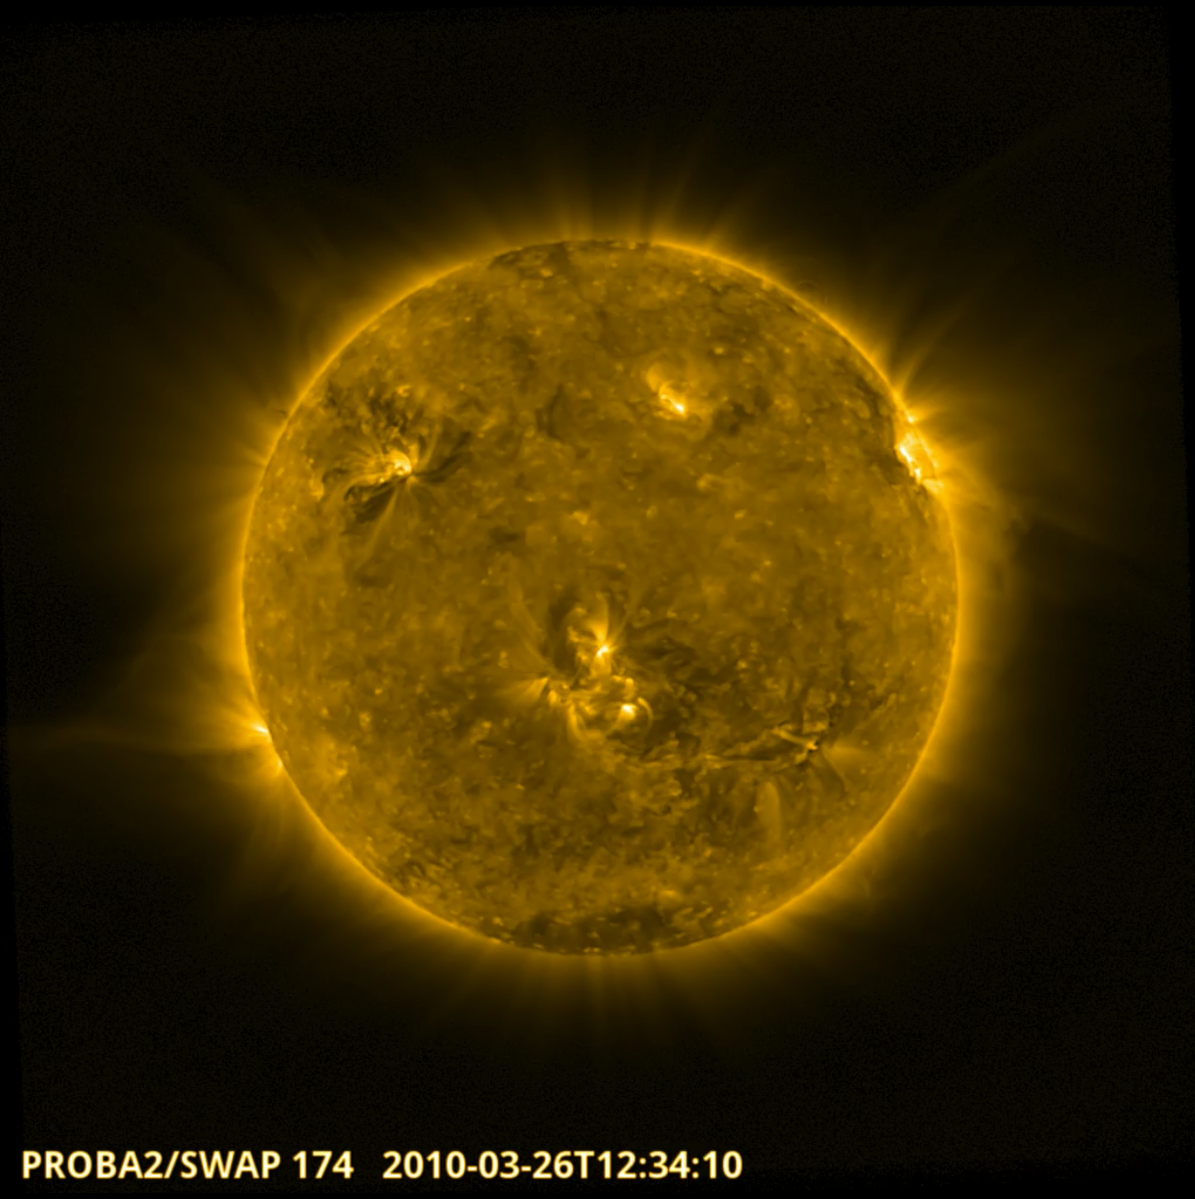
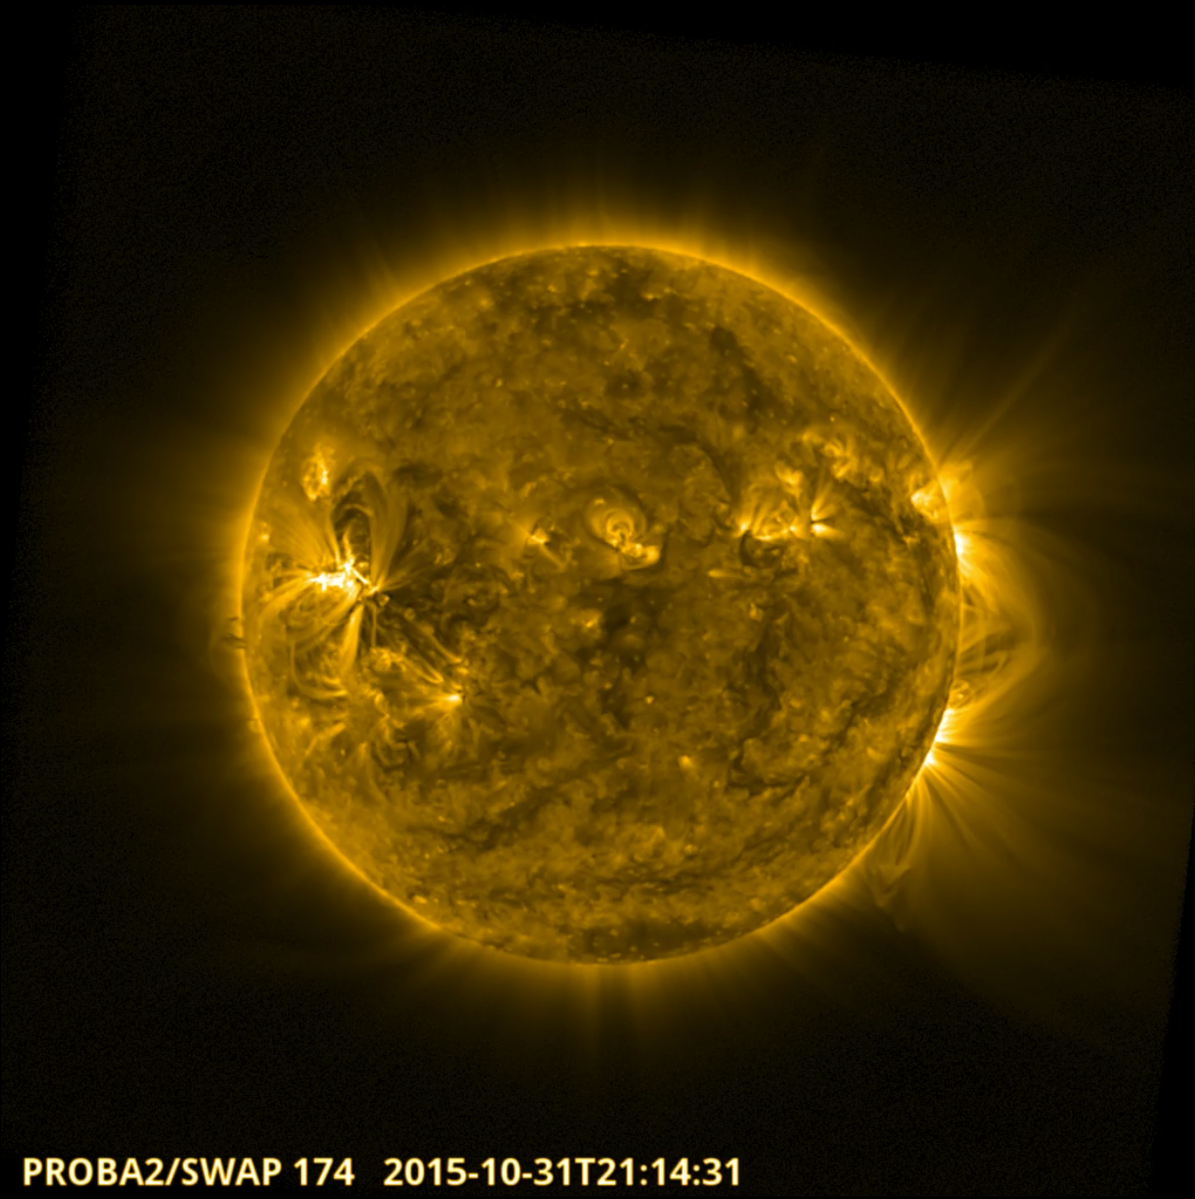
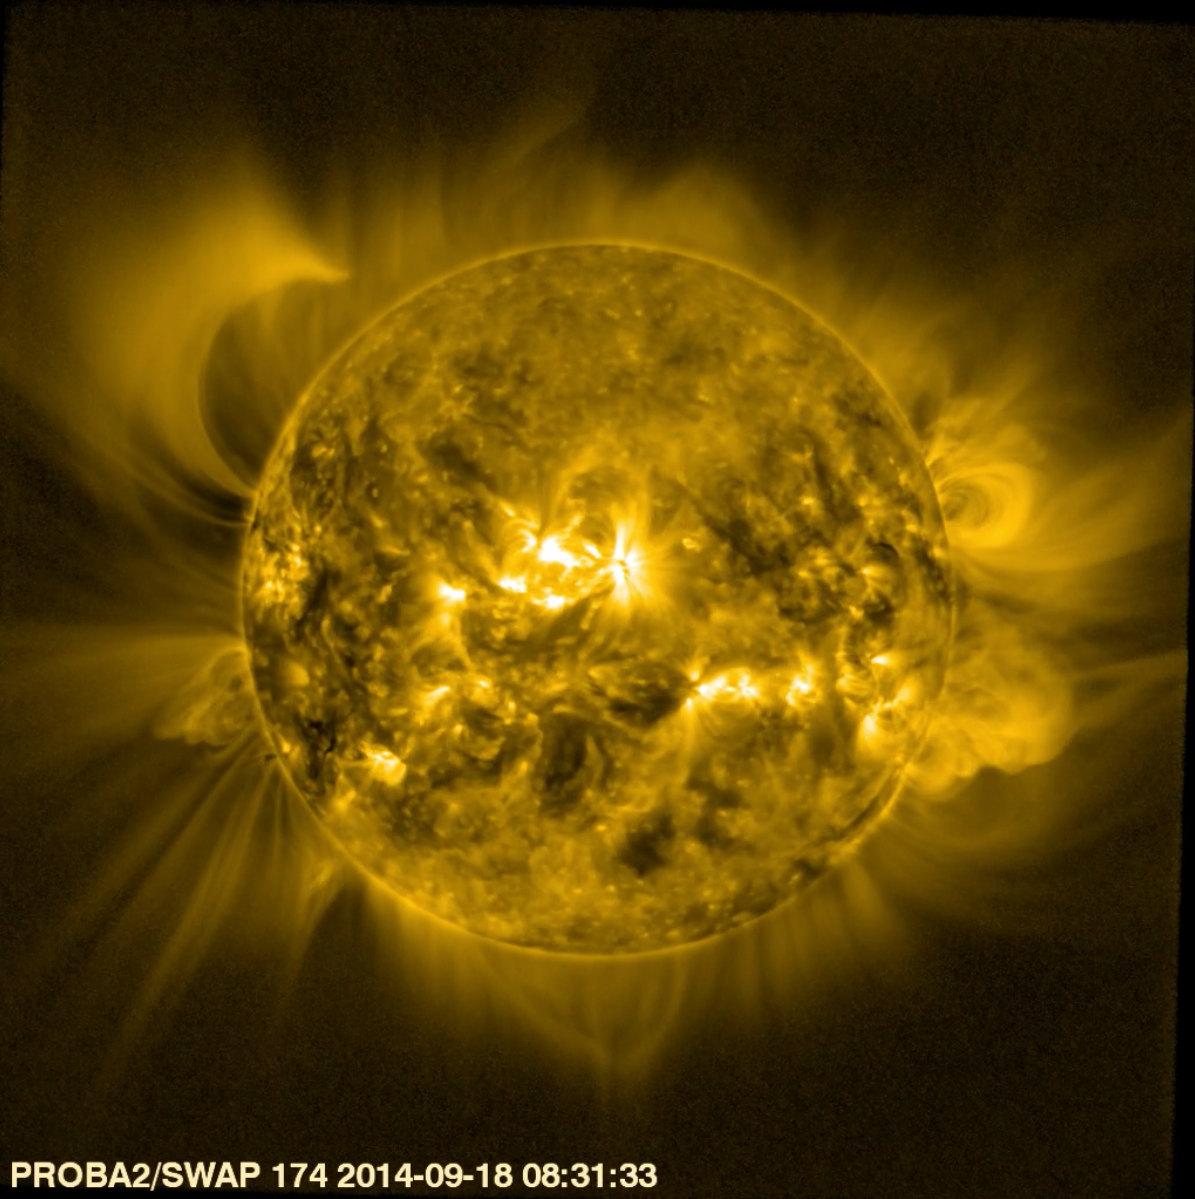
Figure 3 compares three images of the Sun taken at different times during the solar cycle. The left image of Figure 3 shows the Sun on 26-Mar-2010 at the beginning of PROBA2 observations; which corresponds to the period when solar activity was increasing. The central image shows the Sun on 18-Sep-2014, at one of the peaks in the solar cycle when the Sun exhibited most activity. Finally, the right panel of Figure 3 shows the Sun on 31-Oct-2015, taken during the declining phase of the solar cycle. The large-scale off-limb structure can clearly be seen to change between the different phases of the solar cycle, where the overlying strucures become more complicated at solar maximum. These complicated field structures are generated by the evolving magnetic field and drive solar activity and space weather.
Figure 3. Comparing the sun throughout Solar Cycle 24. The left panel shows the Sun on 26-Mar-2010 (Carrington rotation 2095 Movie) at the start of the rise phase of the solar cycle; The middle panel shows the sun on 18-Sep-2014 (Carrington rotation 2155 Movie) at the peak of activity; and the right panel shows the sun on 31-Oct-2015 (Carrington rotation 2170 Movie) in the declining phase of the solar cycle.
We encourage you to visit our Carrington Rotation Movie Directory to investigate the everchanging face of the Sun for yourself. You may also like our poster showing an image of the Sun from each day of the PROBA2 mission between Feb-2010 and Sep-2016, which can be found here (Warning it is BIG 90MB).
 When observing the Sun for a prolonged period of time, it soon becomes evident that features on its surface, and in its outer atmosphere do not rotate at the same rate. This is because the Sun is not a solid body, but a big ball of magnetised plasma, whose rotation is variable with position and height in the solar atmosphere. One of the most striking observations is that of ‘differential’ rotation, where features on the solar surface and in the solar atmosphere are observed to rotate faster at the equator (rotation period = 25.4 days) when compared to those closer to the poles (rotation period = 36 days). This is evident in observations of sunspots, which have been used as tracers for measuring solar motion for many years.