Main menu
You are here
Solar Activity Increasing
After one of the longest and deepest periods of solar inactivity in recent history, there have been hints the sun is reawakening, just weeks before PROBA2’s launch. For PROBA2 scientists, who hope to study the causes and effects of solar flares, coronal mass ejections, and coronal holes — all associated with increased solar activity — this is good news.
The weekly bulletin from ROB’s Solar Influences Data Center tells the story of one recent event:
Solar activity was quiet during the period. An SIDC ALL QUIET ALERT was active from Monday Oct 12 till Saturday Oct 17. An unnumbered active region in the Southern hemisphere, which approached central meridian towards the end of the period, produced two EIT waves/dimmings (Oct 16 16:00 and again around Oct 17 19:00). No significant flaring was associated with these events. LASCO images showed faint hints of (partial?) halo CMEs.

- EIT Image of Oct 17 Event

The 195 Å EIT image (click on the image to enlarge it) at right shows the small event that triggered the CMEs. The unnamed active region in question is at center, on the southern part of the solar disc.
Although the coronal mass ejections described above were very faint, they triggered a shock with made its way to earth and caused a minor geomagnetic storm. The shock was a slow traveler, but it eventually made it to earth, as described in the SIDC’s daily space weather bulletin:
A shock was observed in the ACE solar wind around midnight 21/22 october. The solar wind speed jumped up from 280 to 340 km/s and the z-component of the interplanetary magnetic field turned southward for about 10hours. The consequence of that is an ongoing geomagnetic storm of Kp=4 magnitude. This shock can be traced back to the eruption/EIT wave observed near central meridian on Oct 17, 19h00. We predicted this geomagnetic storm in the daily forecasts of Oct 18 and Oct 19 but later believed it would no longer reach the Earth. However the low speed ( 340 km/s) of the event is compatible with 5 days travel time from the Sun to the Earth.

- ACE Plot for Oct 22 Storm

You can see the arrival of the event near earth in the plot of solar wind measurements by ACE (click to enlarge). Note the jump in solar wind speed near midnight UTC on October 22 and the corresponding increase in the magnetic field readings (Bt and Bz on the top plot). When Bz is negative (corresponding to a southward-pointing interplanetary magnetic field) geomagnetic activity is generally increased.
From the plots you can see that it’s no surprise that it took five days for the event’s effects to be felt on earth. The relatively slow speed of the solar wind behind it (340 km/s) works out to about a 5 day travel time to cover the 150 million km between sun and earth.
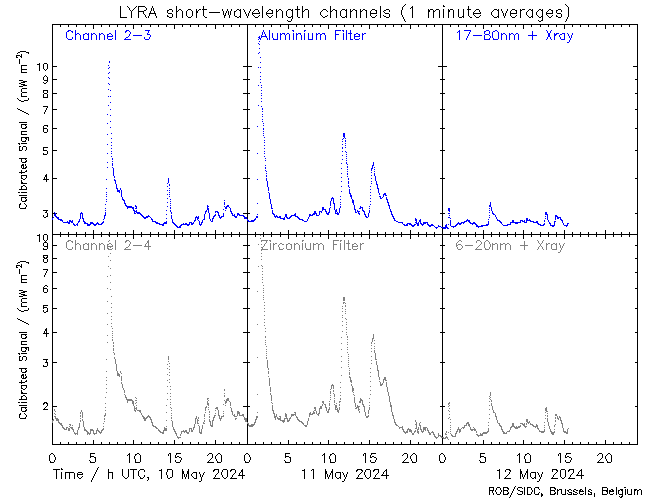
LYRA Latest
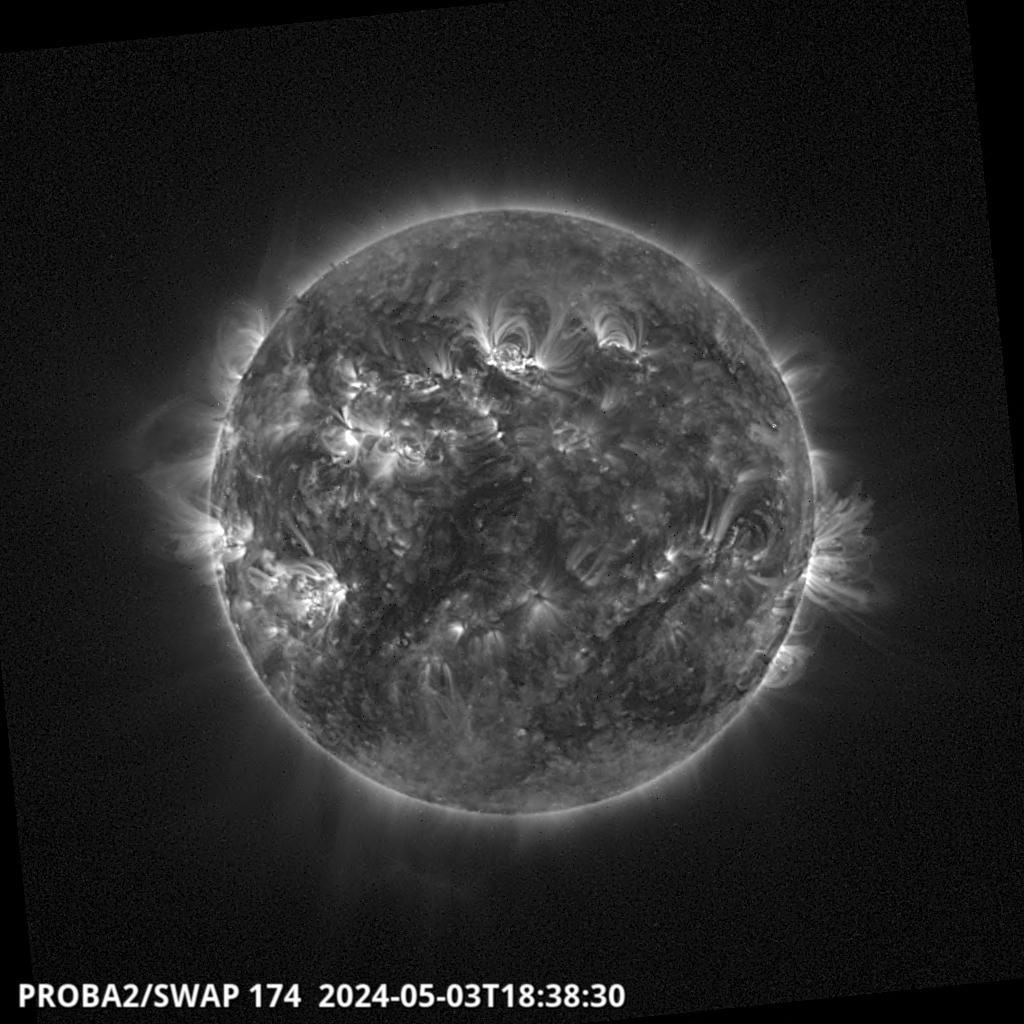
SWAP Latest
Carrington Rotation Movie Latest
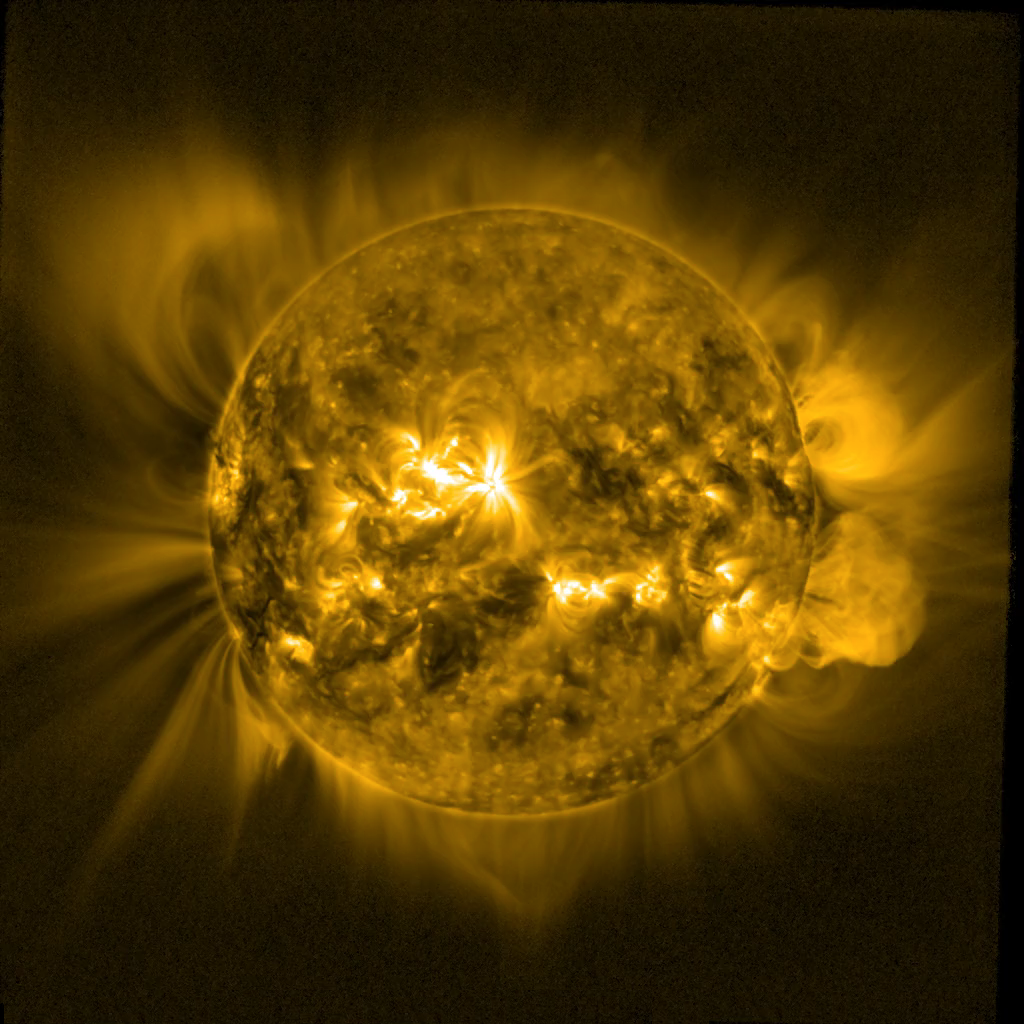
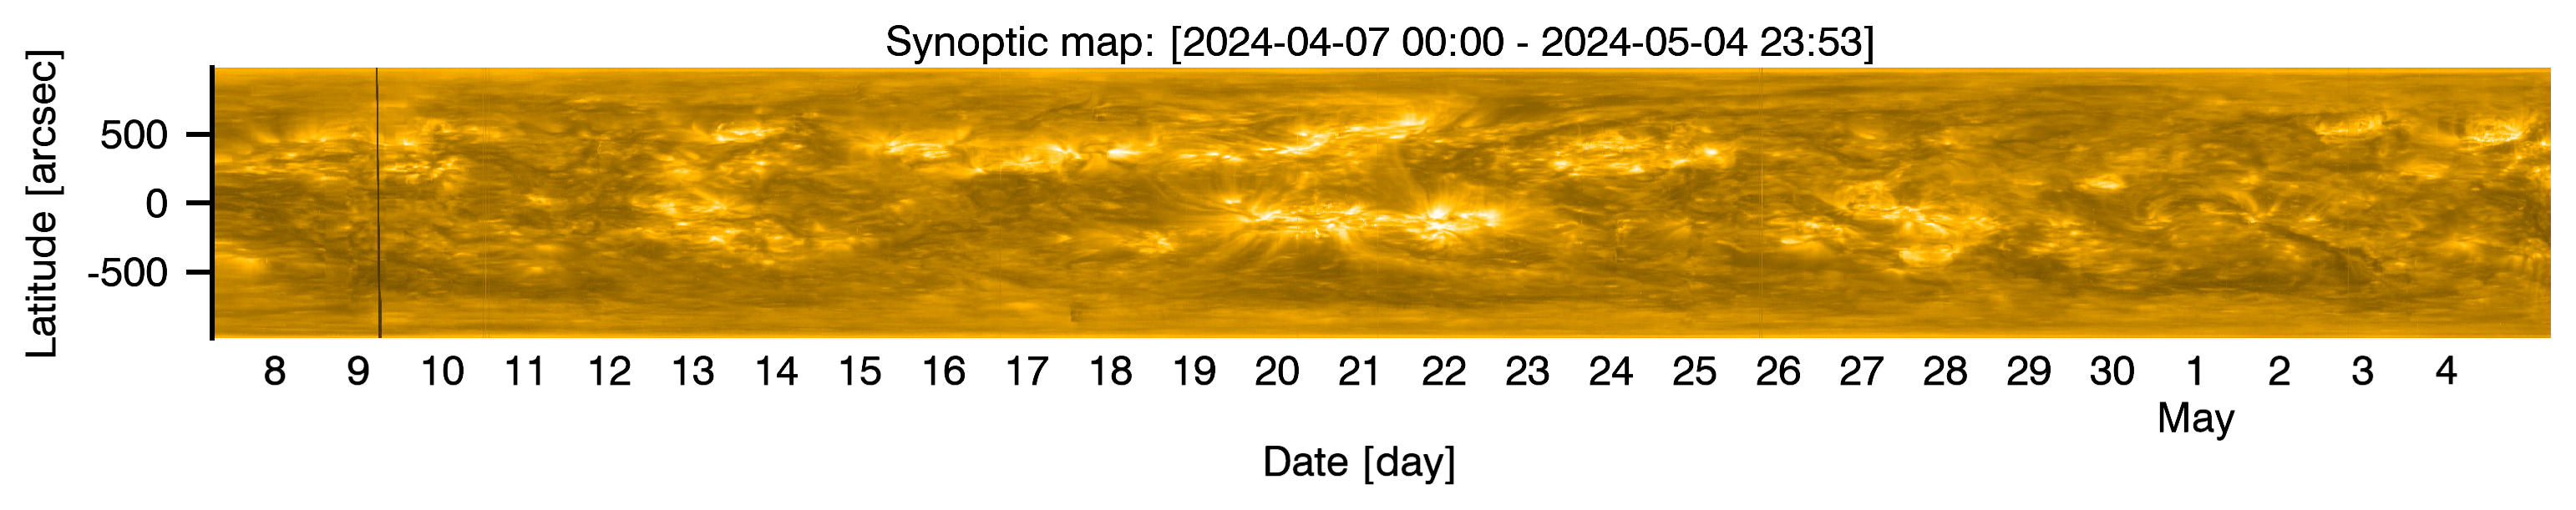
SWAP Synoptic Image
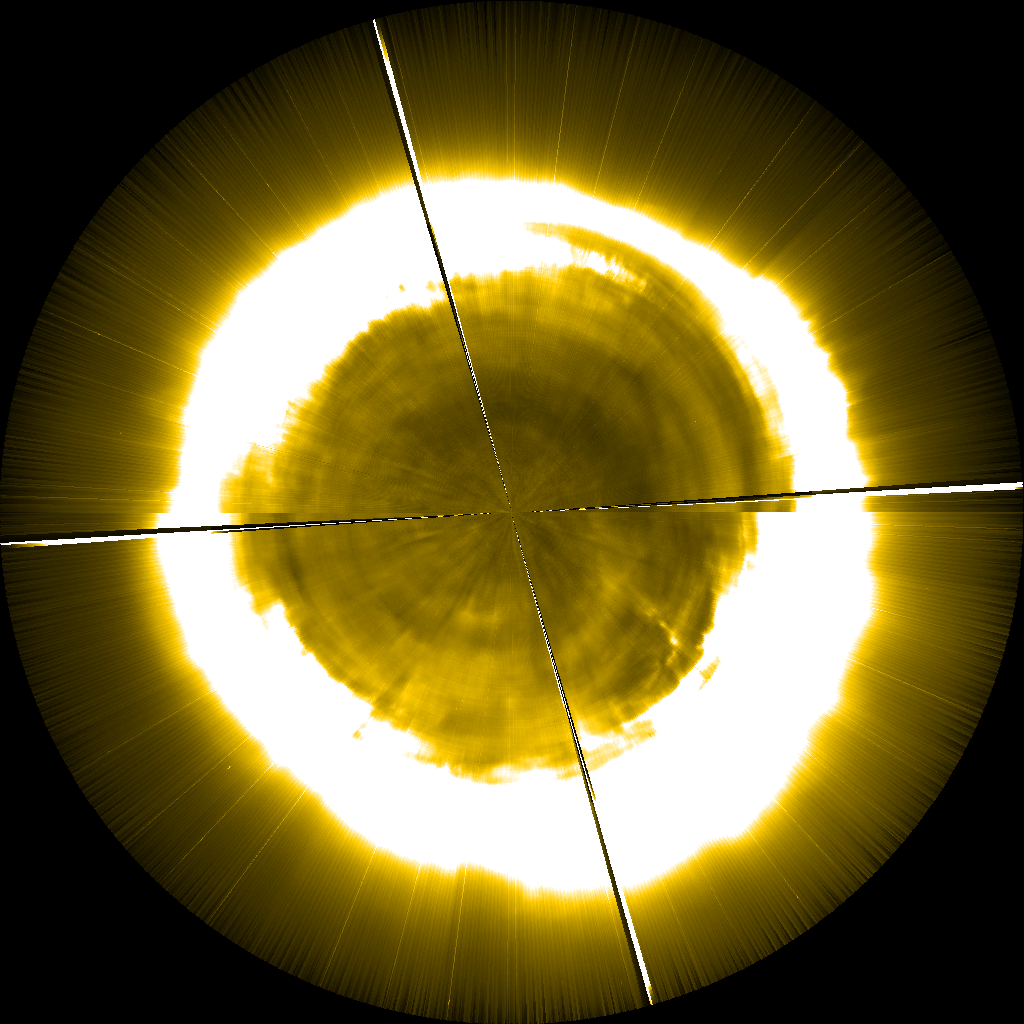
SWAP Polar Image