Main menu
You are here
Solar Polar Images of the Sun
 The solar poles are relatively unexplored regions of the solar atmosphere, this is due to a lack of satellites that have travelled over and through them. In this article we briefly explore how we can use current instrumentation to generate artificial polar images, and what might be learnt from studying the solar poles.
The Ulysses mission (1990-2009), a joint venture between NASA and ESA, was the only mission to truly explore these regions. Thanks to its orbit, Ulysses probed the Sun at large a range of latitudes, and between 1994 and 1995 traversed the southern and northern Polar Regions. The mission included several instruments that measured the “in-situ” plasma properties, but alas did not include any imaging instruments.
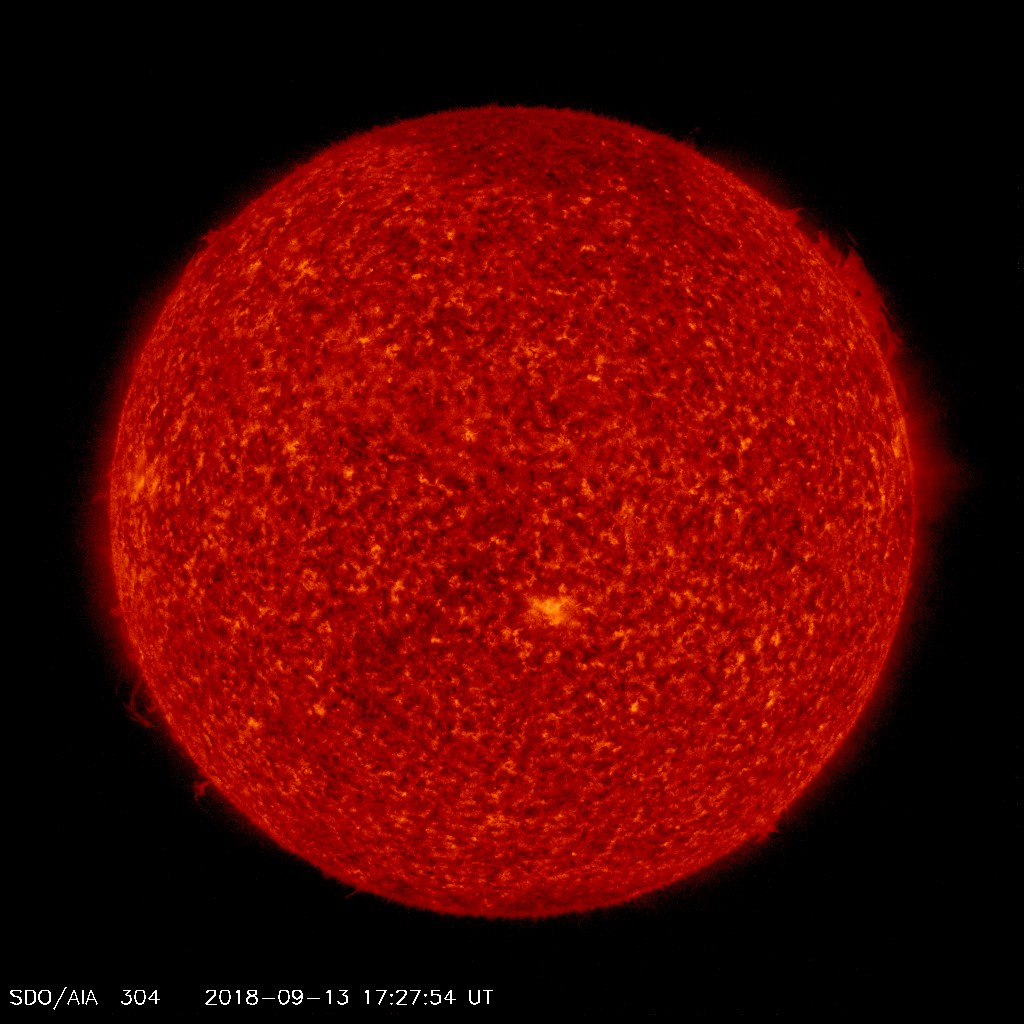
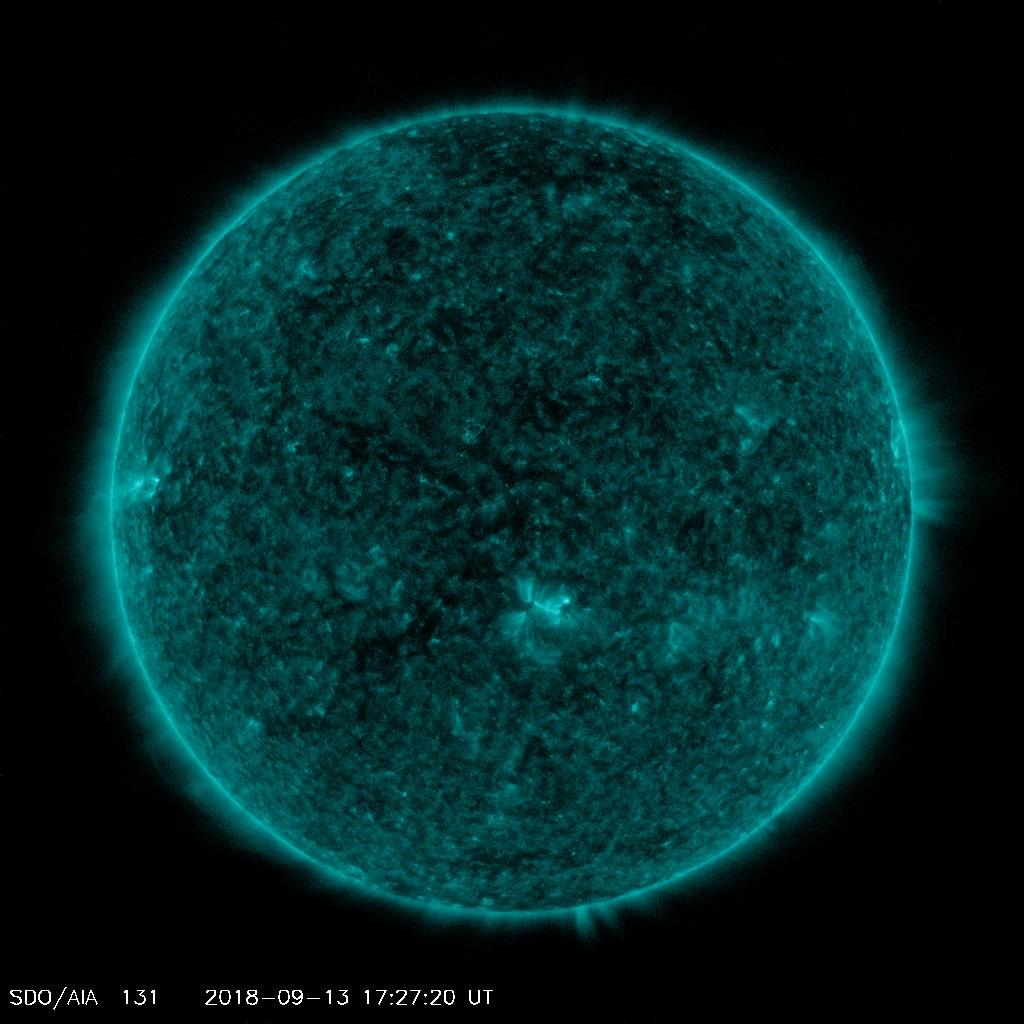
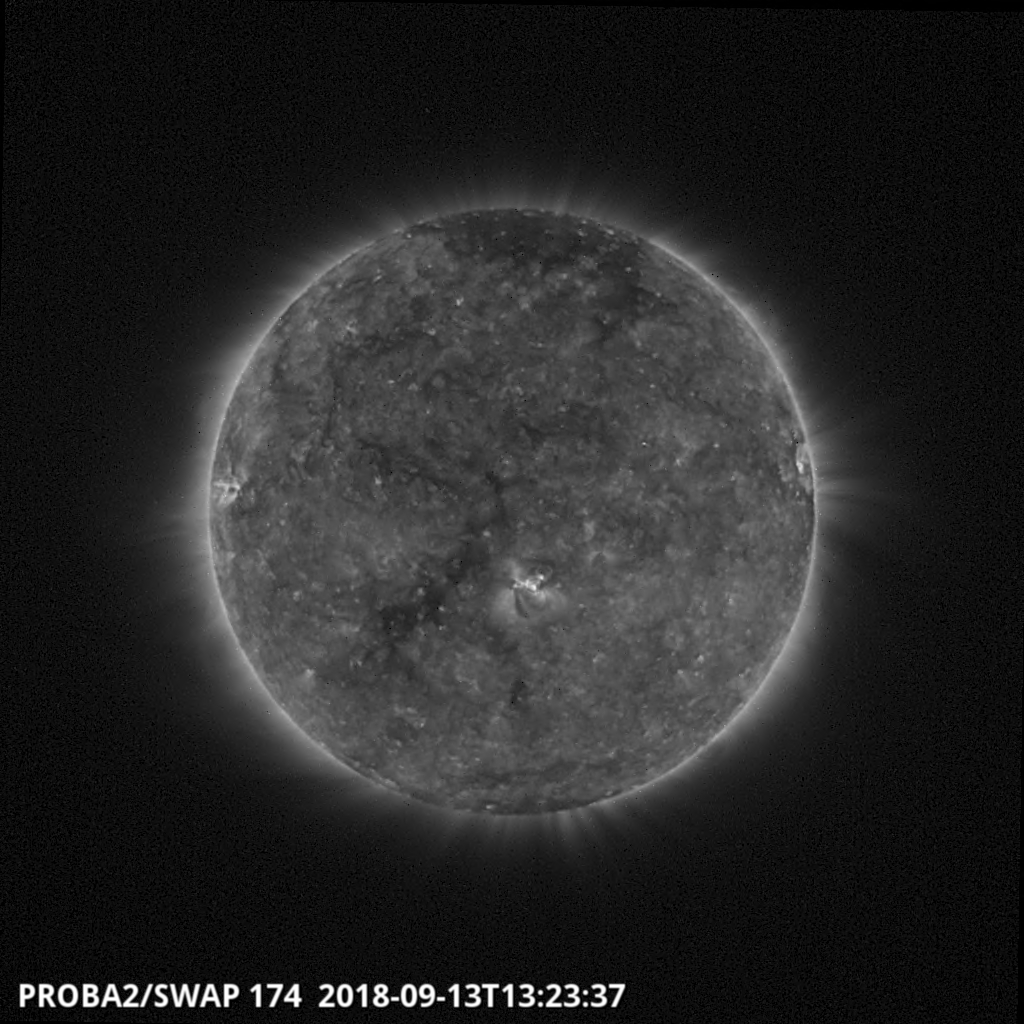
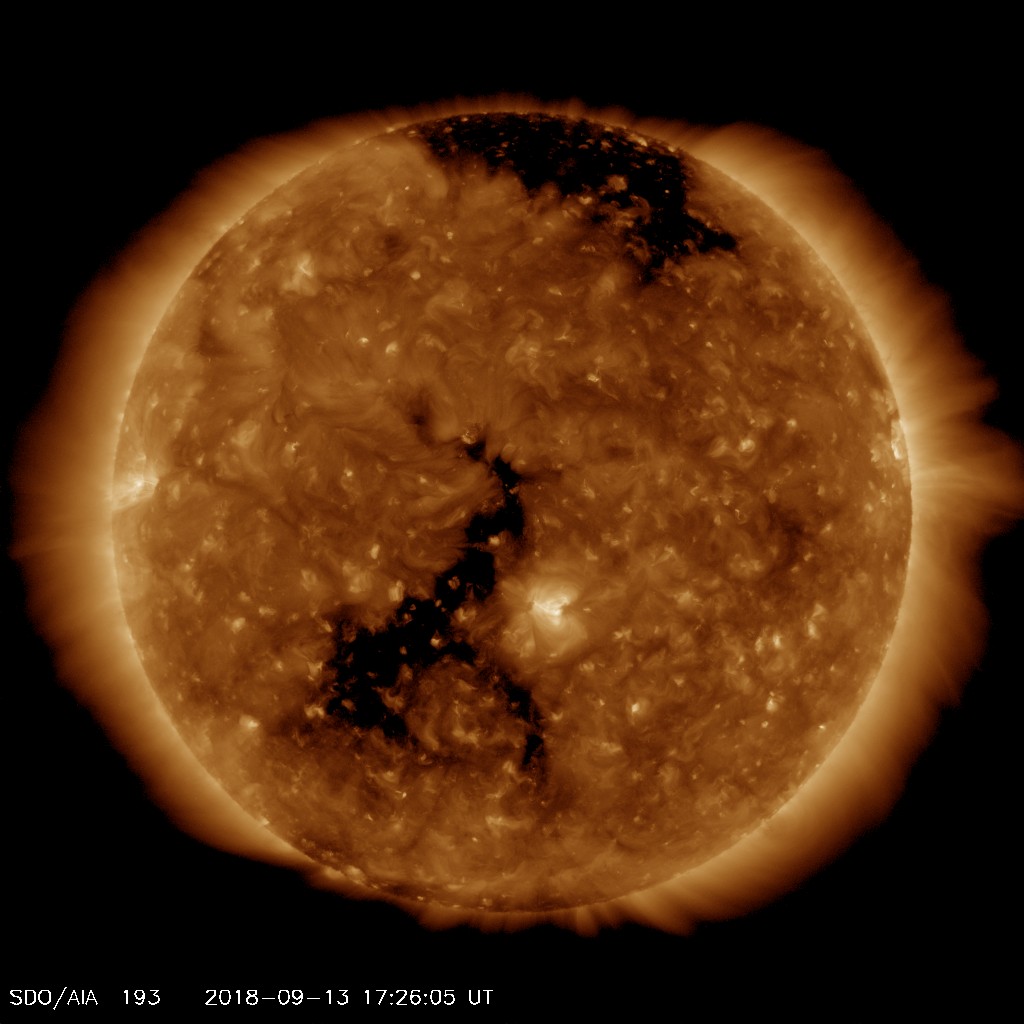
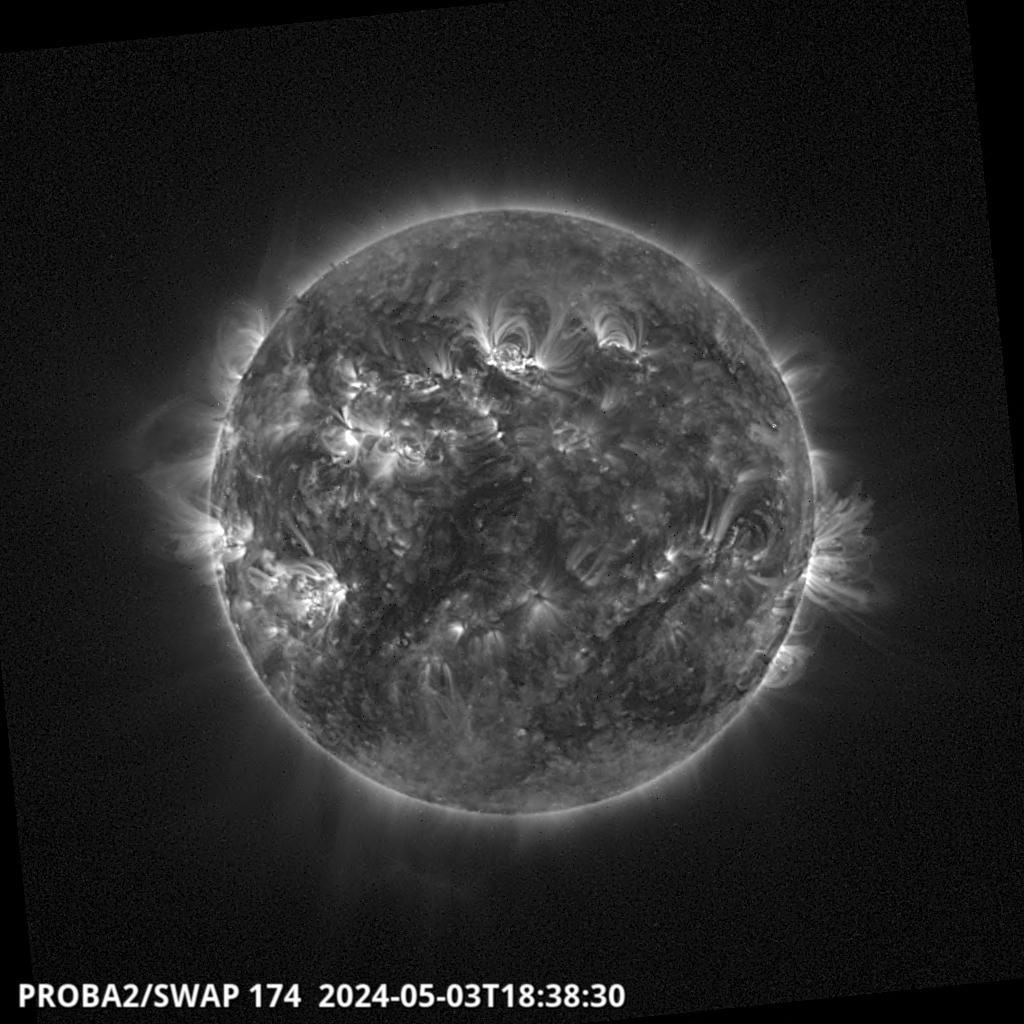
We currently observe the sun through a range of wavelengths in the visible, EUV and X-ray portions of the electromagnetic spectrum. The solar atmosphere is best observed through narrow passband filters centered on EUV and X-ray wavelengths, as these reveal the hot structures making up the Sun's atmosphere, whilst removing the cooler but more intense regions closer to the solar surface. Some examples of EUV observations of the Sun can be seen in Figure 1.


Taking advantage of optically thin structures - Although we cannot observe the whole solar pole directly, we can take advantage of the optically thin nature of our observations to try and reconstruct what we might see in the polar regions. We know that when we observe the solar atmosphere we see everything along the line of sight, therefore if we were to look down on the top of the Sun (when looking at the north pole) we can expect to see the combined signal of the atmosphere above the sun down to the solar disk. The cartoon below explains a simple method used to construct images of what we might expect to observe from a solar imager located over the pole.
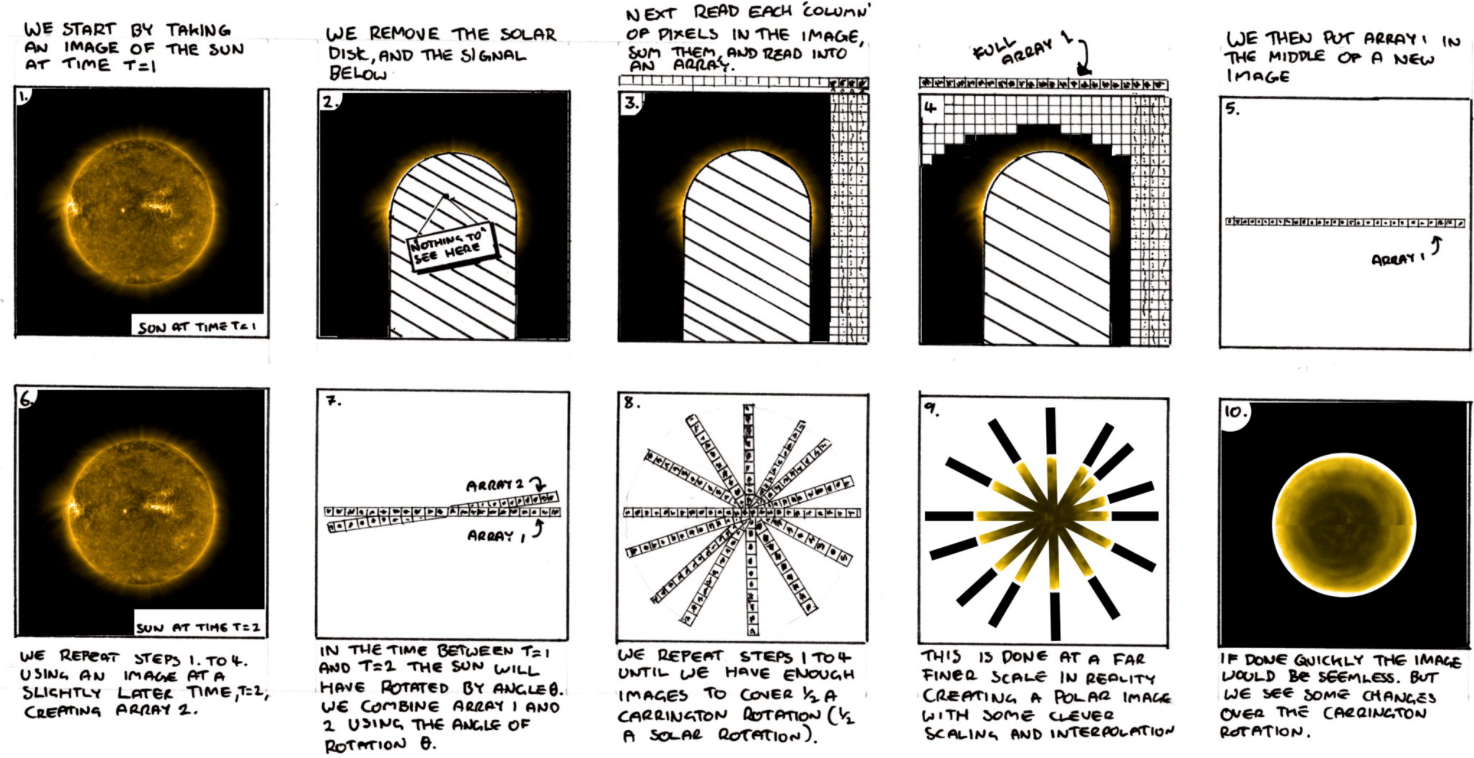
Figure 2. The cartoon above highlights a simple method to construct images of the solar poles using images taken from the ecliptic, such as those from SWAP.
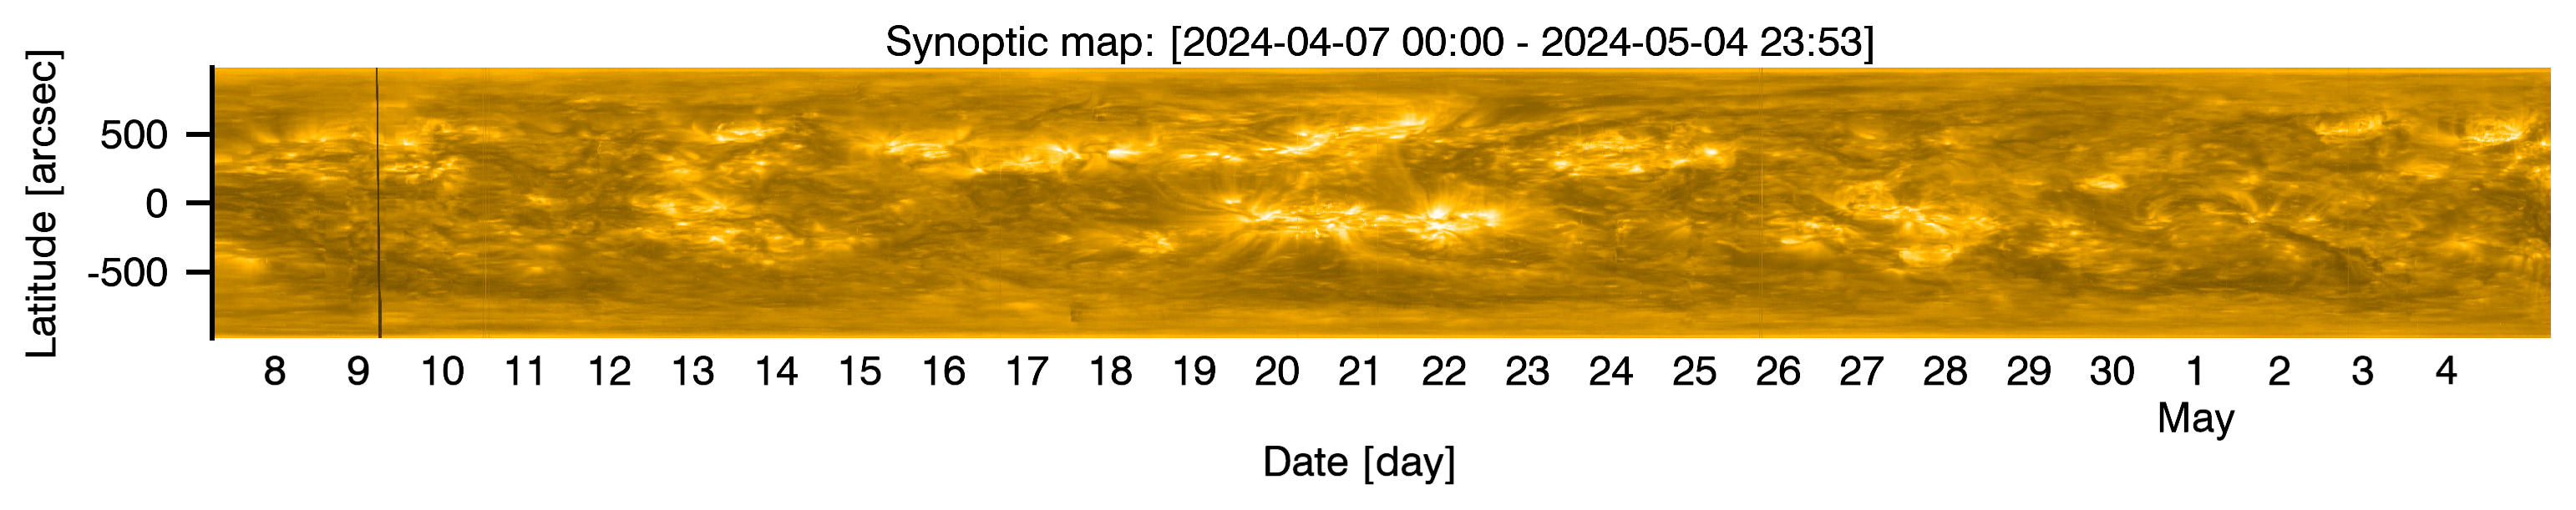
Using the techniques described in Figure 2 with SWAP data we are currently constructing polar images on a daily basis, which can be found here and here, and the latest images (updated daily) can be seen below in Figure 3 below. We currently generate two images, both of the north polar region, one with the bright edge of the lower latitude sun included (Figure 3, Left) and one with this edge removed (right). As described in Figure 2, each image is composed of half a Carrington rotation (half a rotation of the solar disk, more info can be found here) of individual solar images. The line seen across the middle is created due to small changes that occur in the solar atmosphere over this period.
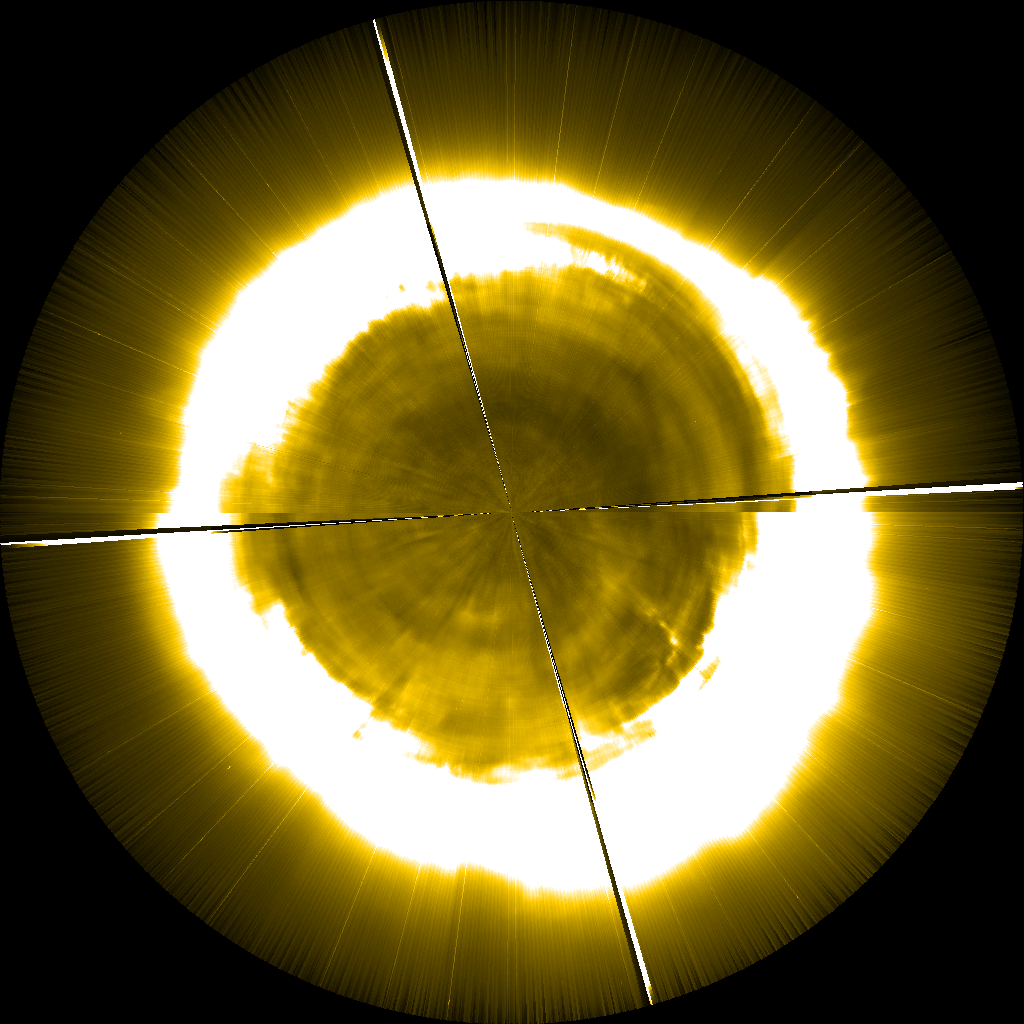
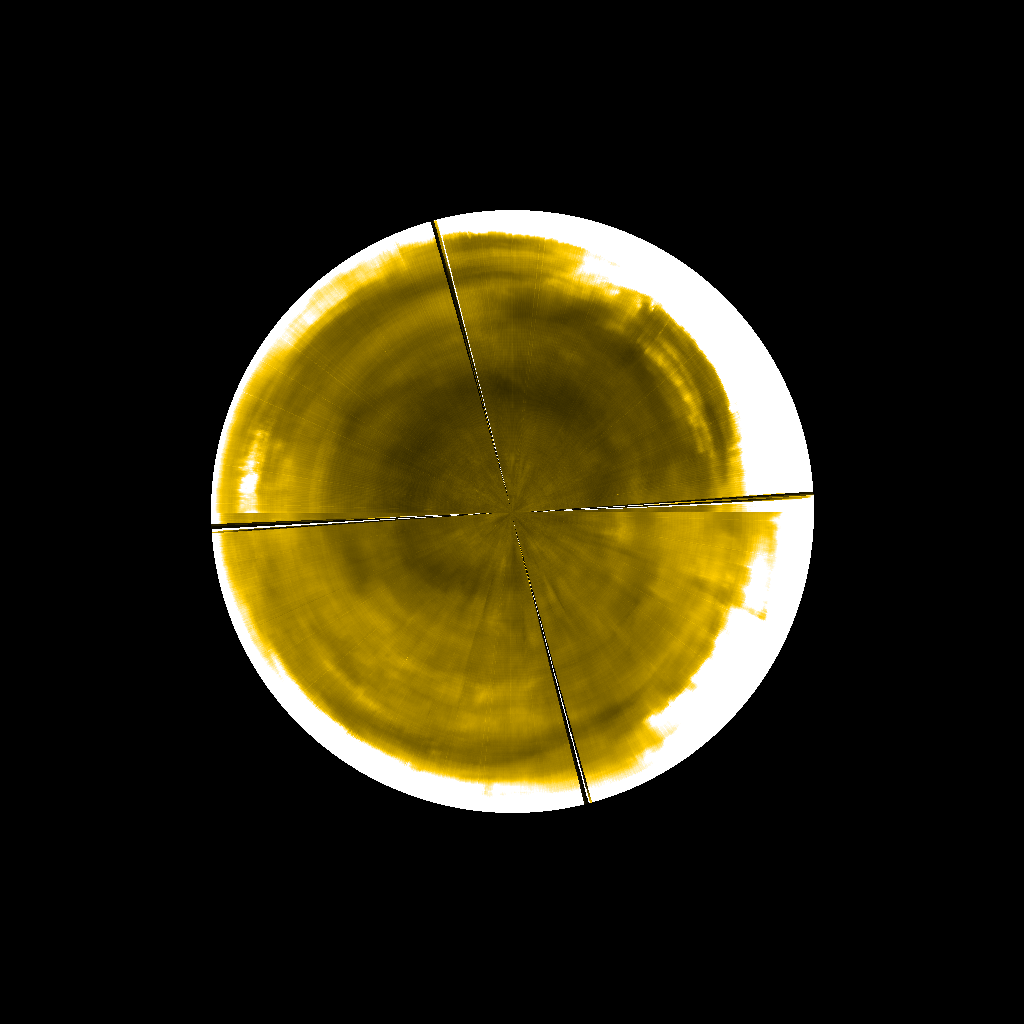
Figure 3. The above two images are the latest polar images generated with SWAP data. The left image includes off-limb structures, whereas the right image has had this removed.
An animated image generated from several weeks of polar observations can be seen in Figure 4 below. Throughout the movie a couple of lines appear, these are generated when the SWAP instrument off-points (Sun not in the centre of the image) to perform other scientific studies.
Room For Improvement - Over the coming months you can expect to see several improvements in the way the above images are generated. These will include:
- The tecnhnique currenly makes the gross assumption that all the emission is coming from a single plane (contradicting the optically thin assumption). This will be refined by using a single strip of pixels around the solar disk.
- Further to point 1, back projection tomography will be implemented to more accurately reconstruct the pole.
- A radial filter will be applied to help improve the saturated limb contribution (the bright edge).
- The Sun is a big ball of hot plasma and does not rotate as a solid body, but rotates at different speeds at different latitudes, a process known as differential rotation. This rotation has been modelled, so we know at what speeds different latitudes rotate. An improved model will be used to improve the accuracy of the images.
- The line generated due to using half a Carrington Rotation worth of images will be reduced using some smoothing and interpolation techniques.
- Different wavelengths from the SDO/AIA and NOAA/SUVI mission will be used to see differing structures observed in different wavelengths and temperatures.
Why are we interested in observing the polar regions? - Due to our lack of observations and measurements there are still several open questions and areas of research concerning this region:-
The most obvious area of research revolves around study of the polar coronal holes, and especially their boundaries, in particular studying the dynamics of a process known as interchange reconnection occurring between open (coronal hole region) and closed magnetic flux (quiet sun) at the boundaries. On longer time-scales we can also further study the formation of the polar coronal holes.
Wave propagation in the polar regions has not been fully explored, especially Alfvén wave propagation in the coronal open-field regions. An on-going area of research revolves around looking for further evidence of wave emergence from below (spicules) or waves generated by reconnection (brightenings) higher up in the solar atmosphere in this region.
Ulysses revealed one pole of the sun is cooler than the other. Using high resolution images of the polar regions may help in understanding if there are more small-scale heating processes occurring in one of the polar regions compared to the other, creating a temperature anisotropy.
On a larger-scale, global waves (Rossby-like) related to coronal hole boundaries could be studied.


LYRA Latest
SWAP Latest
Carrington Rotation Movie Latest
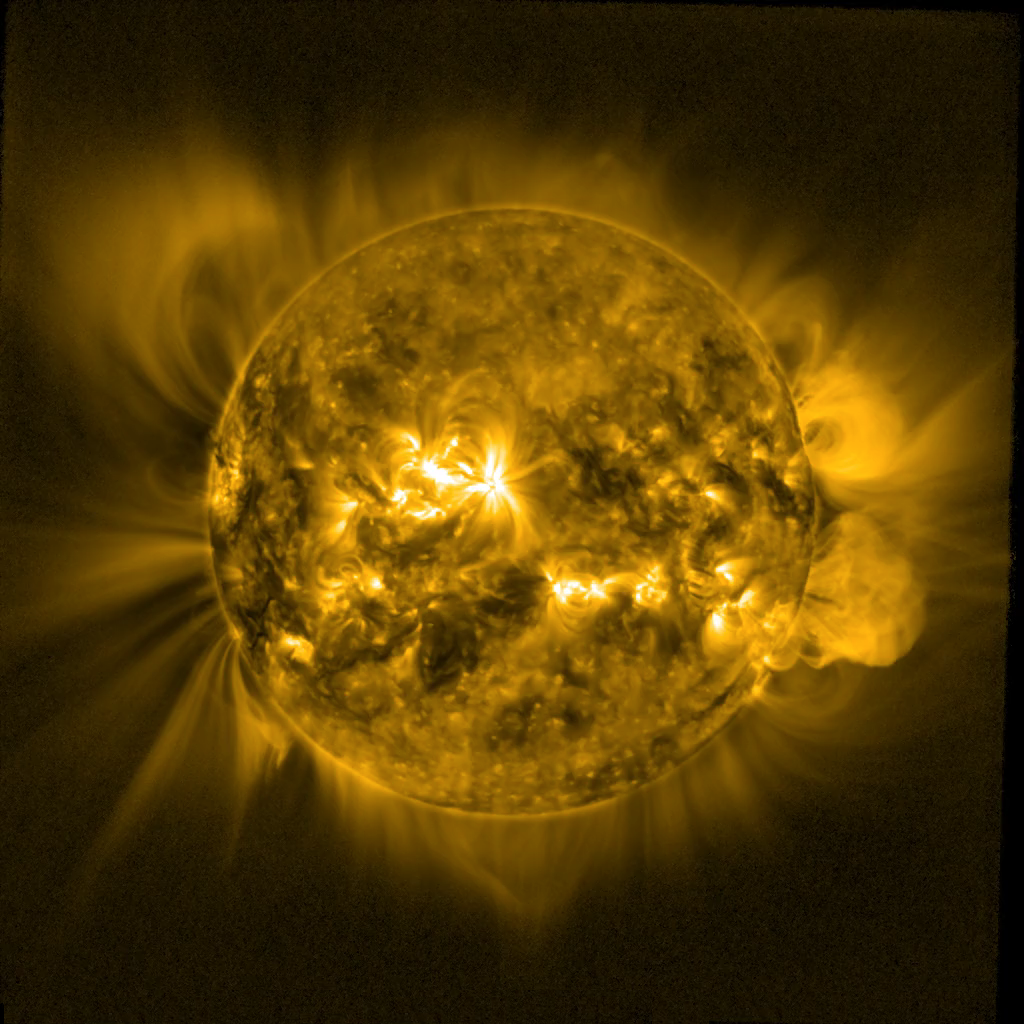
SWAP Synoptic Image
SWAP Polar Image