Main menu
You are here
Long-term evolution of the solar corona using PROBA2 data
Tue, 07/07/2020 - 14:04 — Elke D'Huys


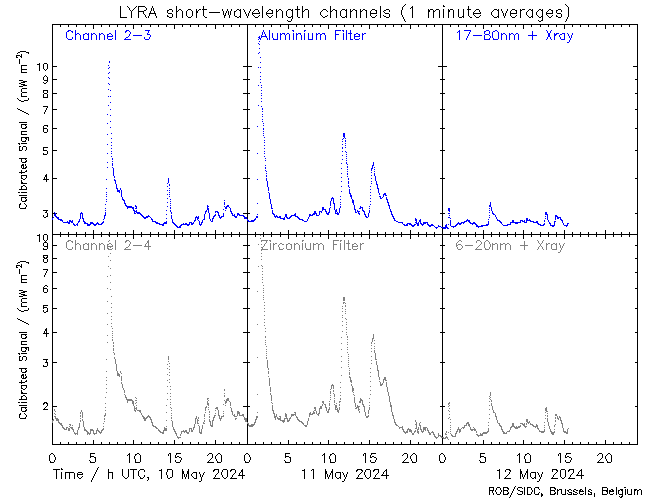
We studied the evolution of the solar corona observed throughout solar cycle 24 (from 2010 to 2019), by using PROBA2/SWAP images, PROBA2/LYRA irradiance time series, and the latest version of the International Sunspot Number (ISN) dataset.
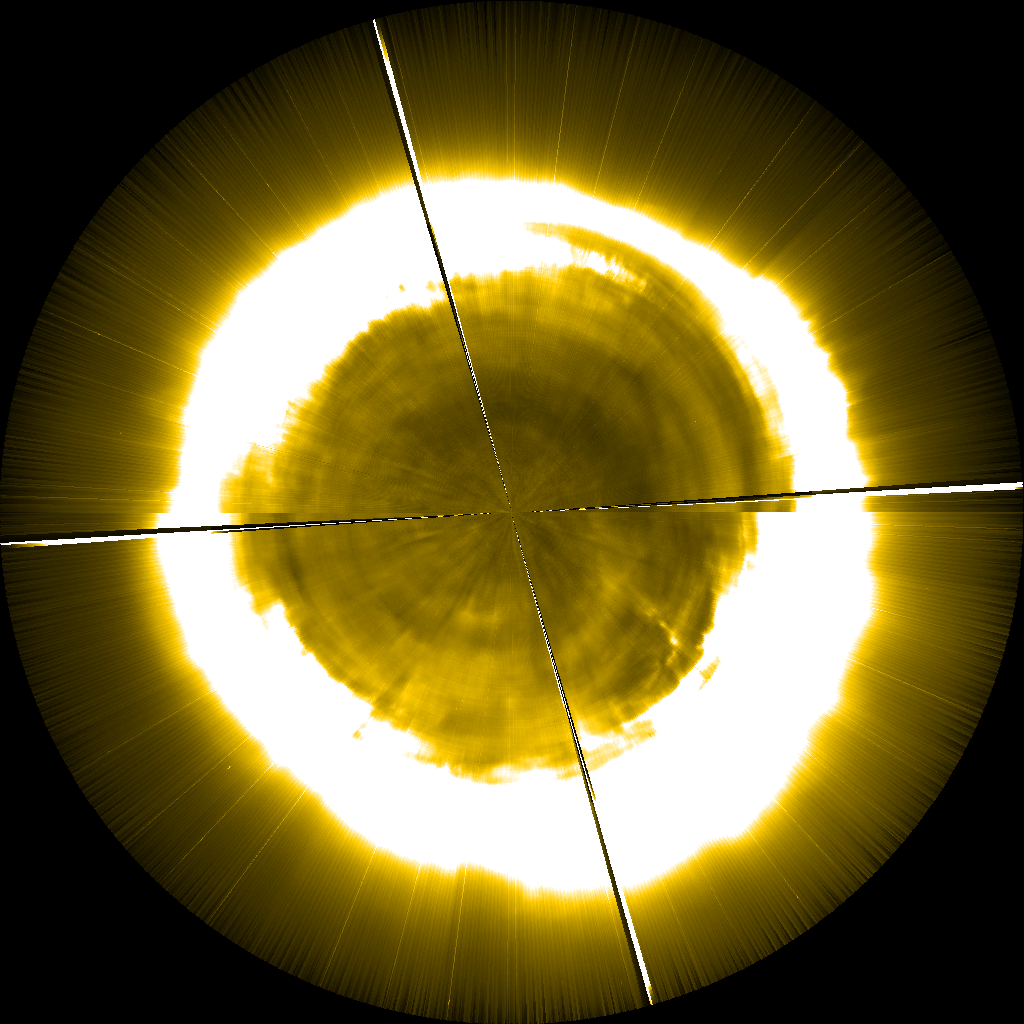
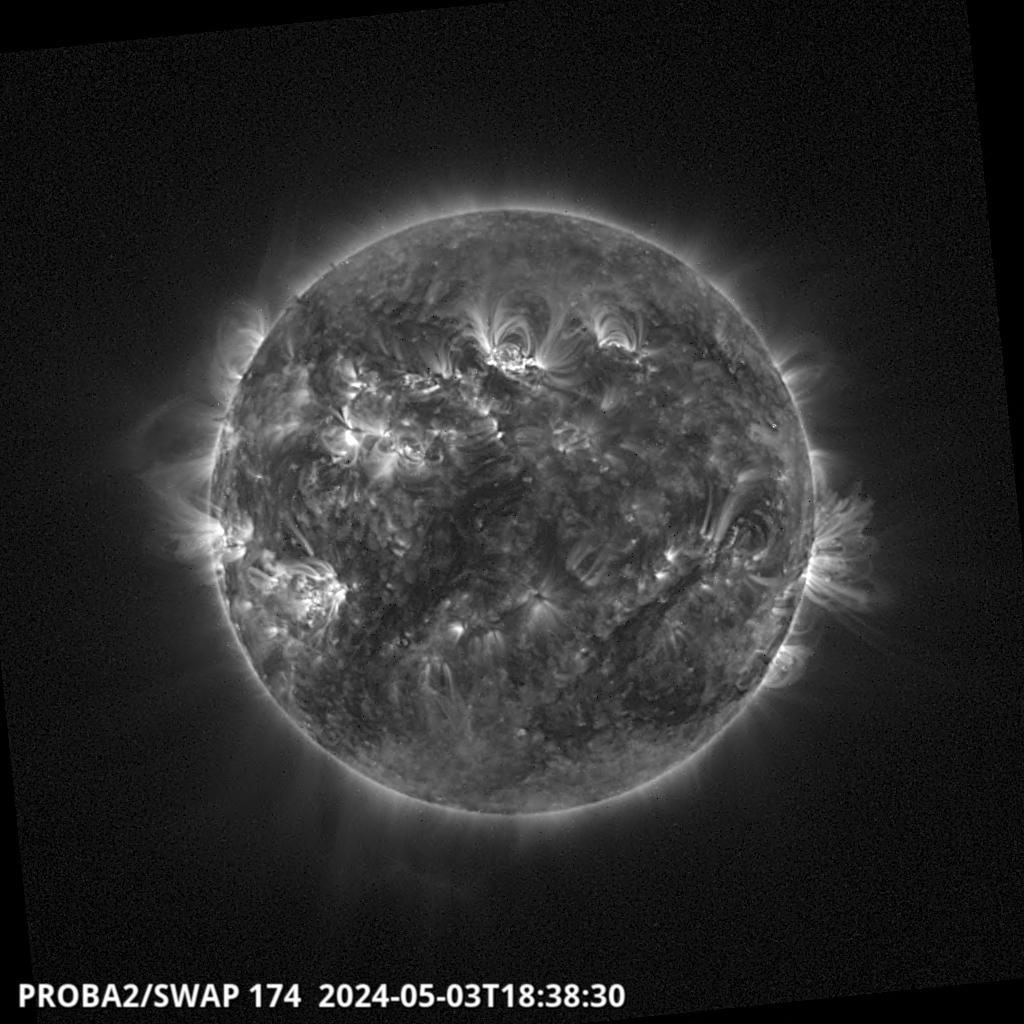
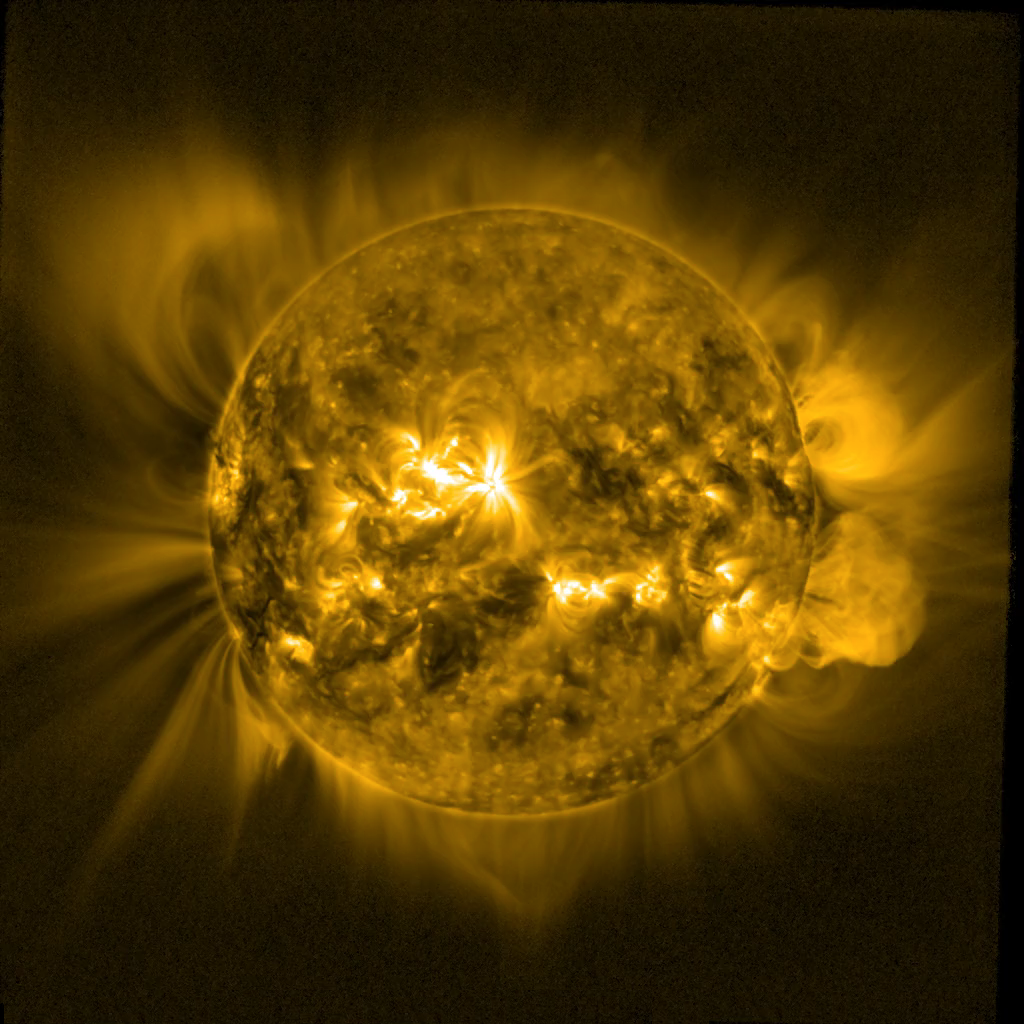
The SWAP EUV imager is monitoring both the changes on the solar disk and the changes in the large scale off-limb features, which can be seen to vary throughout the solar cycle. These large-scale structures trace out magnetic field lines, which are seen due to hot plasmas trapped on them. In a standard SWAP image the signal-to-noise in these regions is too small to distinguish individual structures. However, former SWAP PI D. B. Seaton developed an image processing method that employs image stacking and median filtering techniques to improve the signal to noise ratio and enhance the signatures of structures in these regions. The evolution of large-scale structures in solar corona throughout SC24 can be easily seen by examining different Carrington rotation (CR) stacked images throughout the PROBA2 mission.
A CR is a period of time chosen to represent one rotation of the Sun, allowing the comparison of features such as sunspot groups or active regions over time. A period of 27.28 days was chosen to represent a single rotation that largely resembles the recurrence time of features near the equator.
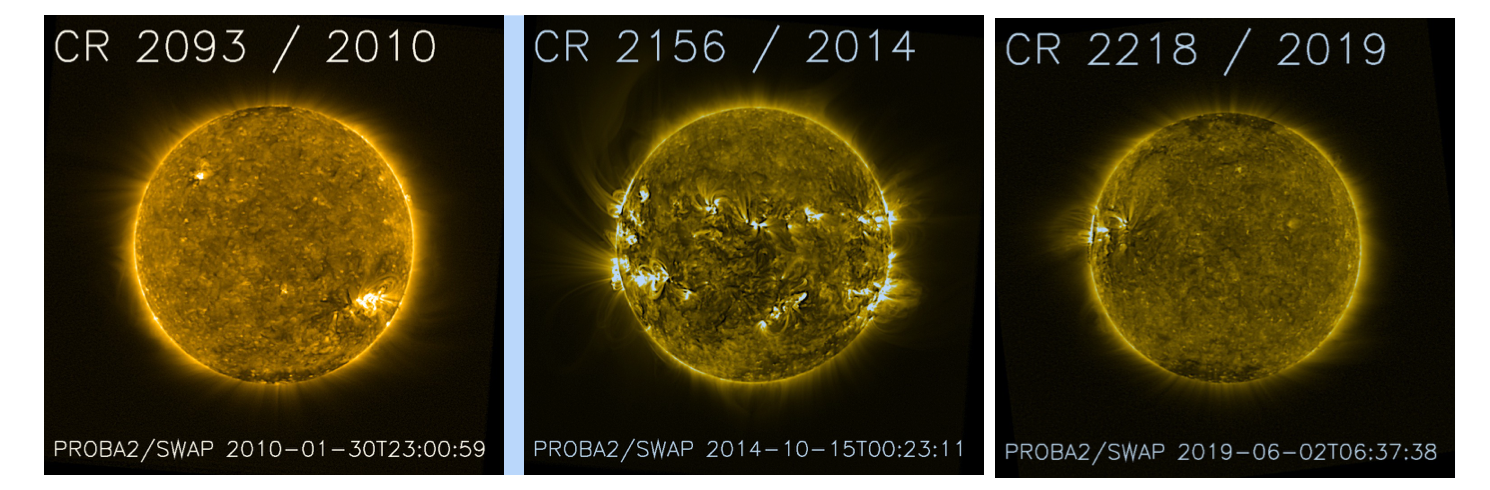
Figure 1 compares three stacked images of the Sun taken at different times during the solar cycle. The left image of Figure 1 shows the Sun on 30-Jan-2010 at the beginning of PROBA2 observations, which corresponds to the period when solar activity was increasing. The central image shows the Sun on 15-Oct-2014, at one of the peaks in the solar cycle when the Sun exhibited most activity. Finally, the right panel of Figure 1 shows the Sun on 2-Jun-2019, taken during the minimum phase of the solar cycle. The large-scale off-limb structure can clearly be seen to change between the different phases of the solar cycle, where the overlying structures become more complex at solar maximum. They were visible from around March 2011 to around March 2016, meaning they were absent at the minimum phase of the solar cycle. A fan-like structure in the northern hemisphere was seen to persist for more than 11 CRs (February 2014 to March 2015) and was observed out to 1.6 solar radii. These complicated field structures are generated by the evolving magnetic field and can drive solar activity and space weather.
Fig.1 SWAP stacked images showing the solar corona at three moments of time between January 2010 and June 2019.
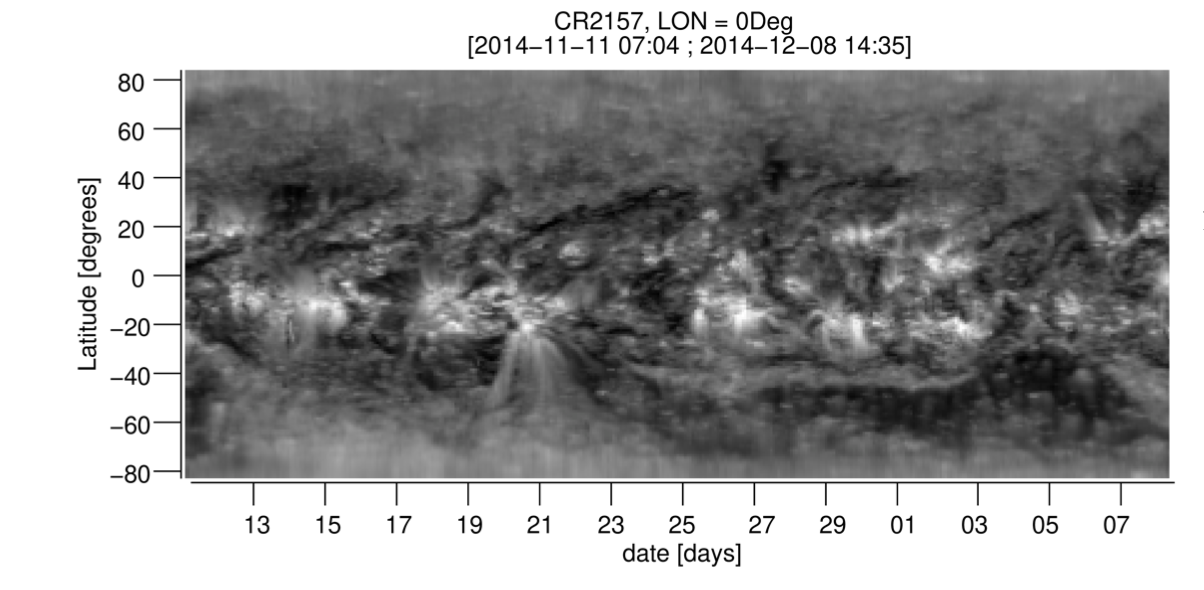
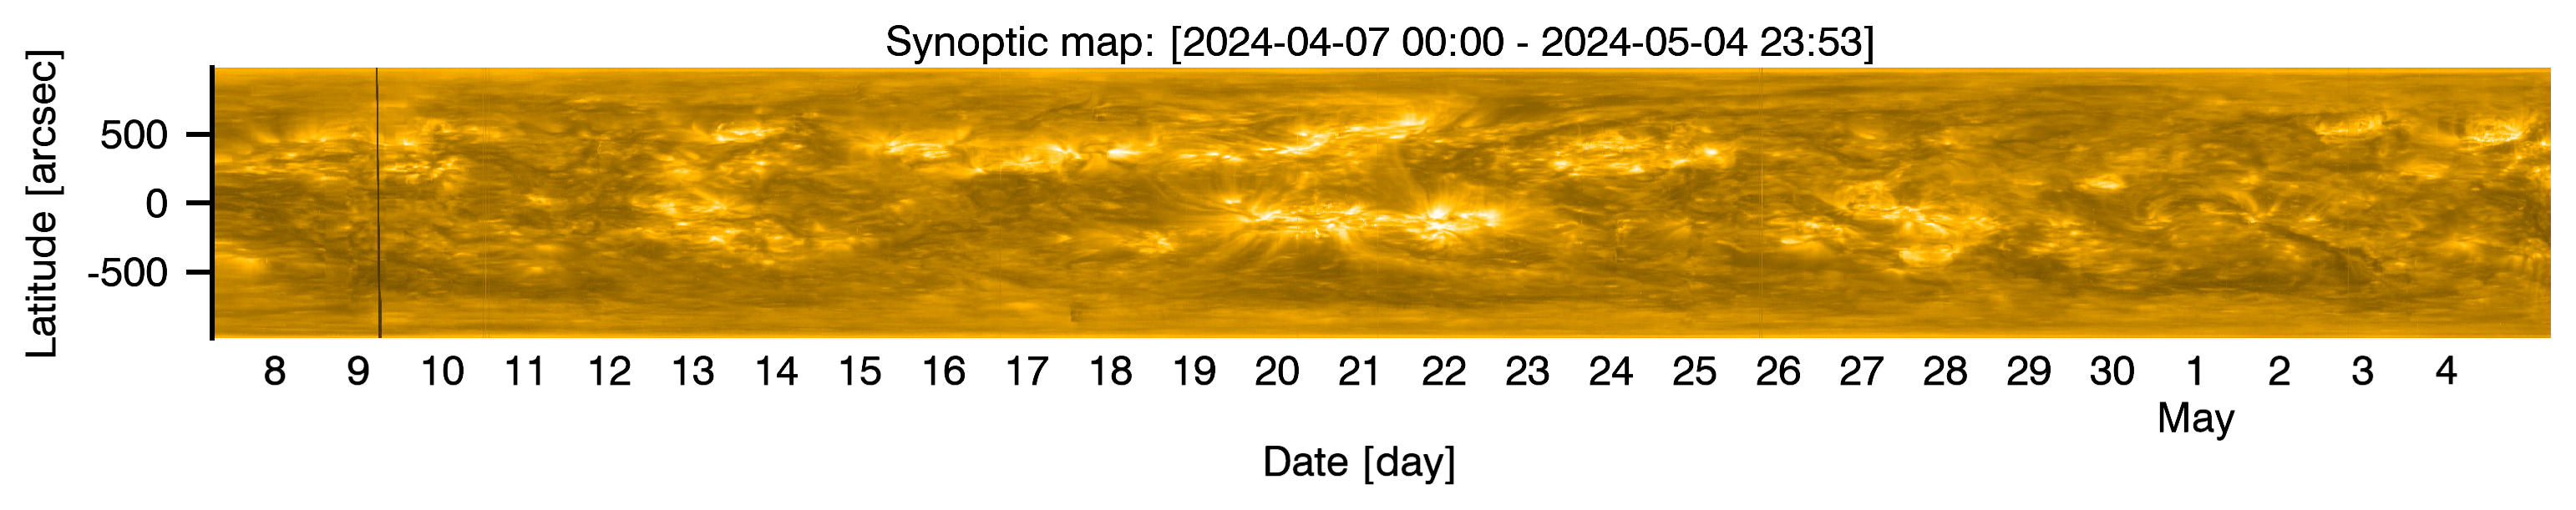
From the synoptic maps (see Figure 2) one can see the evolution of the active regions (ARs) over a full CR as well as the evolution of coronal holes (CHs).
A SWAP synoptic map (or a latitude-time map) is constructed by extracting 3 degree-wide vertical stripes from individual stacked images. Each stripe is averaged into a single vertical line to remove artifacts in an image that might be created by events such as cosmic rays and Solar Energtic Particles striking the detector, or from radiation from the Earth's radiations belts and the South Atlantic Anomaly. A Carrington Rotation's worth of images are then put together side by side to create an image such as the one seen in Figure 2.
By inspecting all the synoptic maps one can see that more ARs started to appear (starting in the northern hemisphere) in February 2011 and they became less frequent beginning in December 2016, reaching a very low number from September 2017 onward, indicating the passage from solar minimum to maximum and back again.
The coronal holes at the north pole were present from February 2010 to October 2011, with some short intermittent periods. No CHs were observed between November 2011 and June 2015, with some short intermittent periods also. They started to develop again in July 2015 and remained visible until June 2019 (end of our dataset). At the south pole the CHs were present from February 2010 to May 2012, with some intermittent periods. No CHs were observed between June 2012 and May 2014. They started to develop again in June 2014 and remained visible until June 2019. The start of the development of the (polar) coronal holes were associated with peaks that we observed at both poles in SWAP data.
Fig.2 SWAP Synoptic Map of the Sun from 11-Nov-2014 to 8-Dec- 2014. The image is constructed from the central meridian of the CR 2157 stacked- images.
When observing the Sun for a long period of time, one can see that features on its surface, and in its outer atmosphere do not rotate at the same rate. This is because the Sun is not a solid body, but a big ball of magnetised plasma, whose rotation is variable with position and height in the solar atmosphere. We found that the average rotation speed, for bright regions between latitudes of -40 and +40 degrees was approximately 14 degree/day. The average rotation rate of bright features at latitudes of +15 , 0 , and −15 degrees was around 15 degree/day throughout the period studied.
We also observed that the three data sets used in this study (SWAP on-disk average brightness, LYRA signal and ISN) had a high degree of correlation (around 0.9), all following the SC evolution.
This work was published in Solar Physics in the frame of PROBA2 special issue “10 Years of Solar Observations”.
Image:
LYRA Latest
SWAP Latest
Carrington Rotation Movie Latest
SWAP Synoptic Image
SWAP Polar Image